EUR/usd
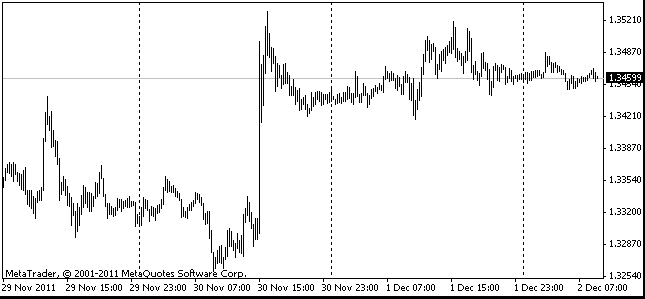
The market still cannot decide on the direction. eurusd continues to flirt with 1.30, though it actually has been above it since April 8. From the technical side, the growth perspectives of the pair are darkened by a strong bearish candlestick of April 17. Now charts show a kind of the “head and shoulders” reversal pattern, which can be confirmed together with breaking through 1.30, if it takes place in the near future. This move may be targeted at 1.2750, which at the same time can become the 5-month low and eventually spur sales in the pair. The US news background is not definite and the markets are still to see the release of major indicators. Now we have to be content with the housing statistics. Yesterday's report on existing home sales was a bit disappointing for those who had expected to see the sales at 5 million. The annual sales rate decreased by 0.6% and made 4.92 in March. However, it was not without reason – the average home price significantly rose. The median price made 184.3 K in March , which is 11.1K greater than in the preceding month and 19.5K greater than in the same month a year before. It's quite an enviable growth rate. If the housing market was a driver of the crisis and its most clear indicator, now it keeps showing healthy growth, by turns in prices and sales volume. For comparison, the indicator of activity on the EU building sector remains on the decline. Its recent value (for February) was 30% less than the peak levels of late 2006, falling both at a monthly and yearly rates.

GBP/USD
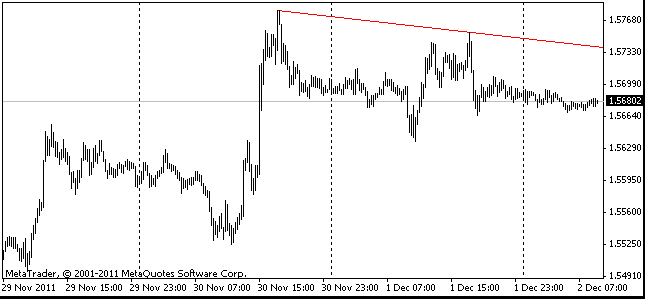
Even Britain is doing much better in the building sector. Measured in the same way as in the eurozone, the British building activity is about 20% below its peak levels, but this is subject to a higher volatility of the indicator. Other indicators, based on the home sales, reflect stability in this sphere – price growth leads to increase in supply, which is then followed by price reduction. Then sellers withdraw their homes from the market. So, at least here the demand and supply model works perfectly. In the meantime, the sterling is trying to form a support at 1.52. For now the attempt seems to be successful, but weak.

USD/JPY
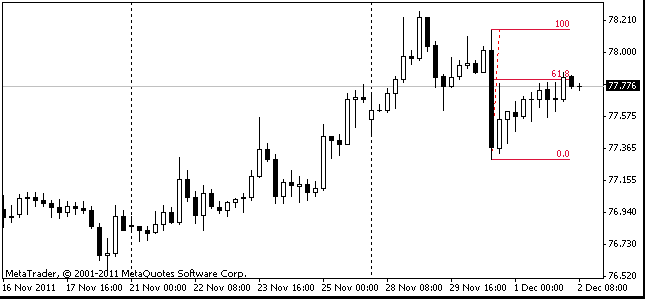
The yen is still unable to break through the resistance at 100 in usdjpy. It is not only an important psychological level for traders and investors, but also a very significant mark for officials. Some politicians at the beginning of the year said that the move to these levels wouldn't be enough. Moreover, a move higher can provoke a free fall of the Japanese currency, in this case the economy and production will slide in a stronger recession than now. In our opinion, the market is ready to stay in the consolidation phase till the very autumn, when fresh forces will come and the annual decline rate won't look that horrific ( the yen began to fall in late September 2012).

AUD/USD
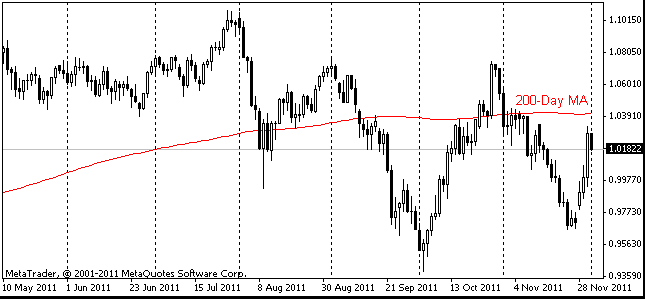
The aussie keeps suffering. Disappointment with the domestic statistics from time to time changes here into weakness caused by reports from China. For example, today's HSBC Flash Manufacturing PMI fell short of expectations. The index made just 50.5 against the expected 51.4. Those, who thought that China's weakness in 1Q resulted from the poor comparison with the longer first quarter of the previous year, had to quickly reconsider their views.
