

- Why ATR Is Used
- What “Probability of a Correction” Means
- How This Probability Is Calculated (Without Complex Terms)
- Why It Looks Like a “Probability Scale”
- How This Differs From Trying to “Guess the Reversal”
- How to Use This Correctly
- Trade Examples:
- Important Note: Probability Is Not a Guarantee
- 🎁 Bonus for GlobeGain Clients
Quantitative Analysis in Trading


Most traders trade “by feel”: it seems like the price is already “too high” or “too low,” so a reversal should come soon. The problem is that the market doesn’t owe anyone anything — and entries like this often turn into a lottery.
Quantitative analysis is a way to remove guesswork and replace it with numbers. There are no “opinions,” “intuition,” or “predictions” here. There is only:
-
the instrument’s history,
-
measuring movement through volatility,
-
statistics,
-
probability.
The main idea: we can look at how often, in the past, after a strong move the price produced a correction of a certain size — for example, by the size of the daily ATR, weekly ATR, or monthly ATR.
Why ATR Is Used
ATR (Average True Range) is an indicator that shows the average “normal” range of price movement over a selected period.
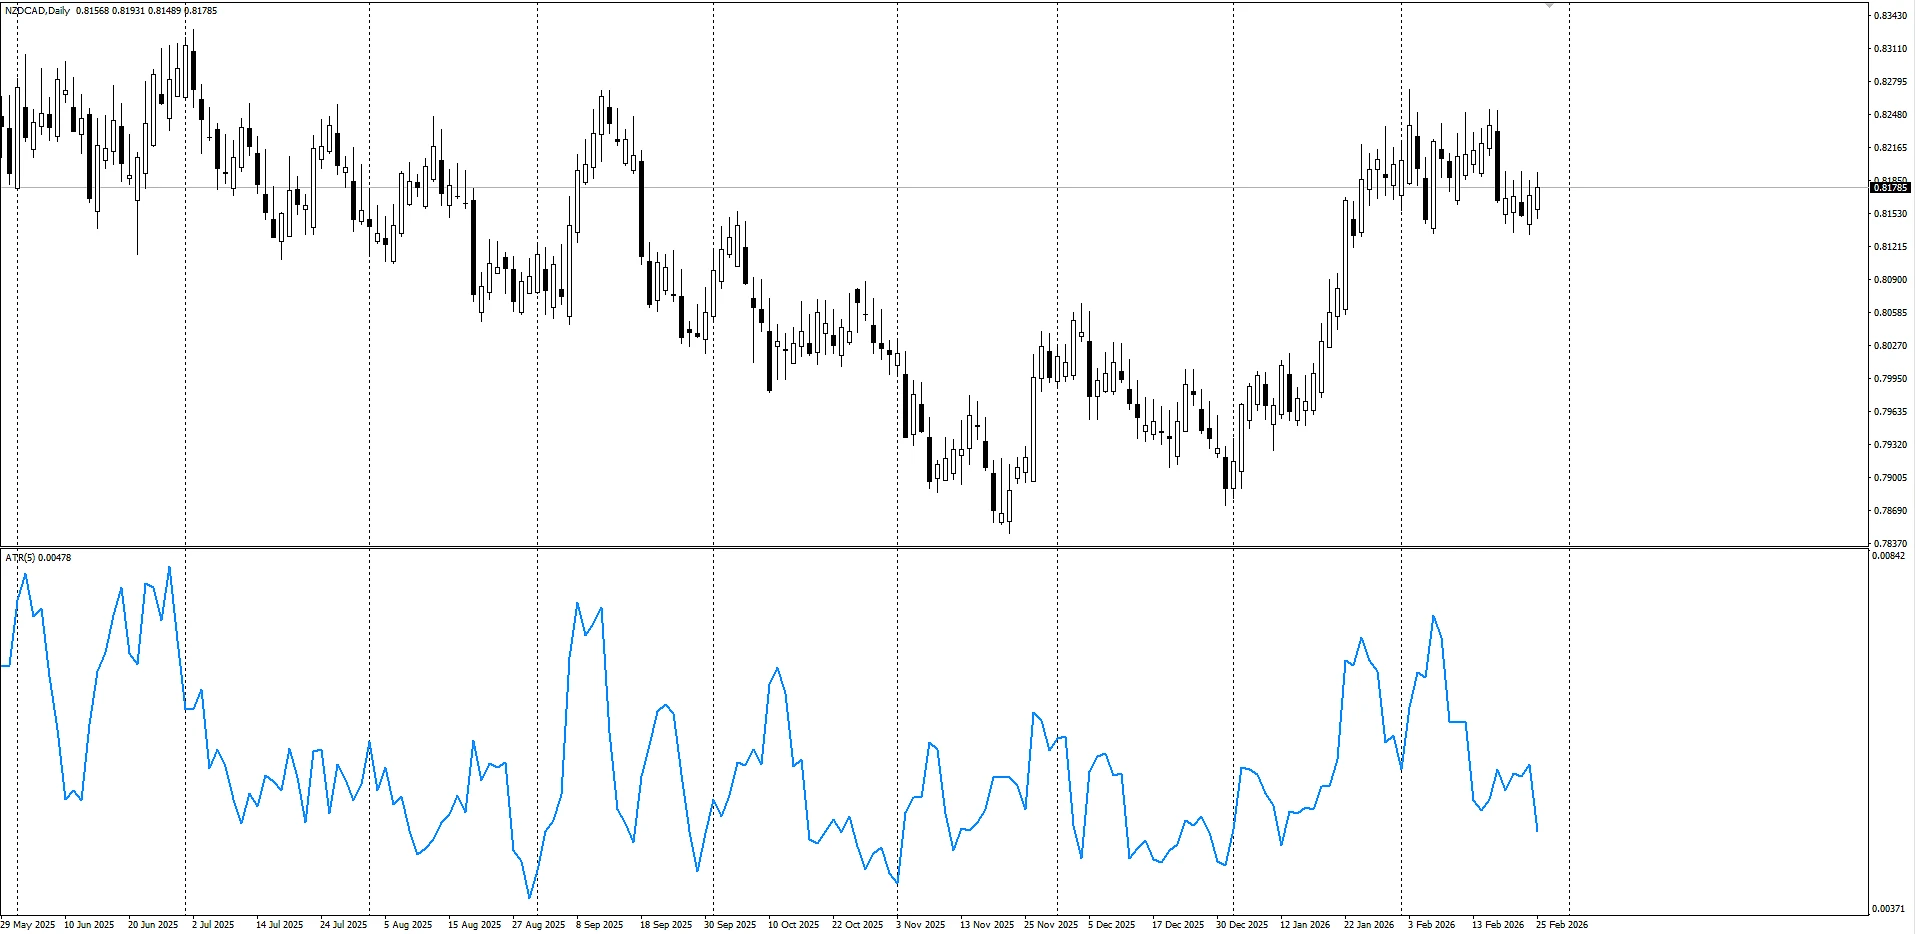
Simply put, ATR answers the question:
“How far does price move on average per day / week / month?”
That’s why ATR is convenient to use as a universal “ruler” for measuring movement.
And most importantly: ATR adapts to the instrument. Each market has its own volatility — ATR takes that into account.
What “Probability of a Correction” Means
When you see phrases in analysis like:
-
“probability of a correction 74%”
-
“probability of a correction 86%”
-
“probability of a correction 96%”
this does not mean “with an 86% probability there will be a reversal tomorrow.”
It means something else:
“If in the past the price made moves of this magnitude, then in X% of cases after that there was a correction of the specified size (for example, 1 ATR).”
In other words, it’s statistics of the instrument’s behavior in similar situations, measured via ATR.
How This Probability Is Calculated (Without Complex Terms)
The process is always the same. Only the timeframe (D1/W1/MN1) and the ATR period change.
Step 1. Choose Which ATR We Care About
For example:
-
daily ATR → we want to assess corrections by the “daily norm”
Step 2. Take the Average ATR Over the Selected Number of Candles
For example:
-
ATR for the last 5 days (D1),
Step 3. Find “Strong Moves” Across the Entire History
Now the most important part.
We take the instrument’s entire history and identify moves (impulses) that are no smaller than the selected “norm” (ATR).
That is:
-
if we calculate correction probability by the daily ATR, we take from history only those moves that were no smaller than the average daily ATR
There can be hundreds or thousands of such moves — that’s the statistical sample.
Step 4. Measure the Size of Each Move
Each identified move is measured in points and converted into a clear format:
-
“how many points the price moved,”
-
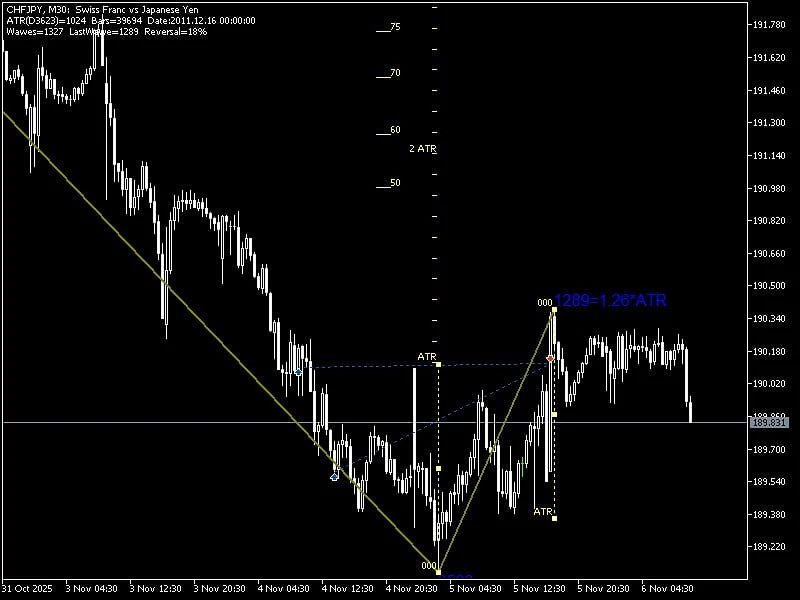
and “how many ATRs that is” (for example, 1.2×ATR, 1.9×ATR, 2.6×ATR)
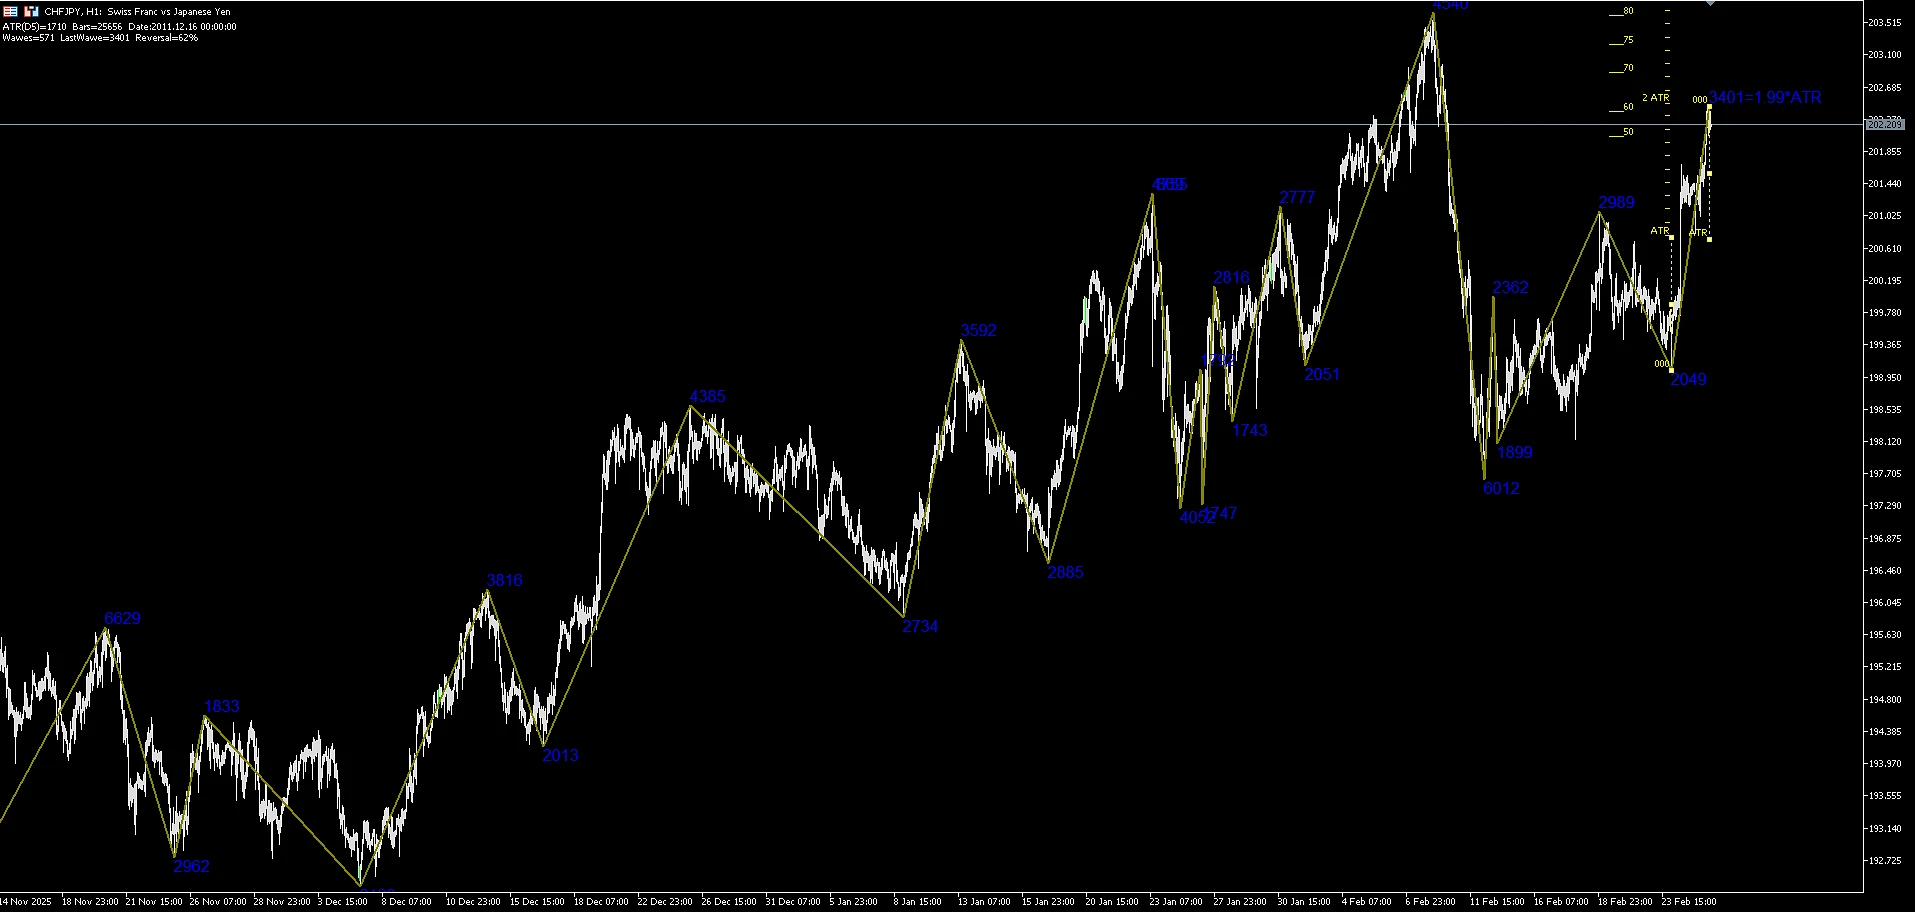
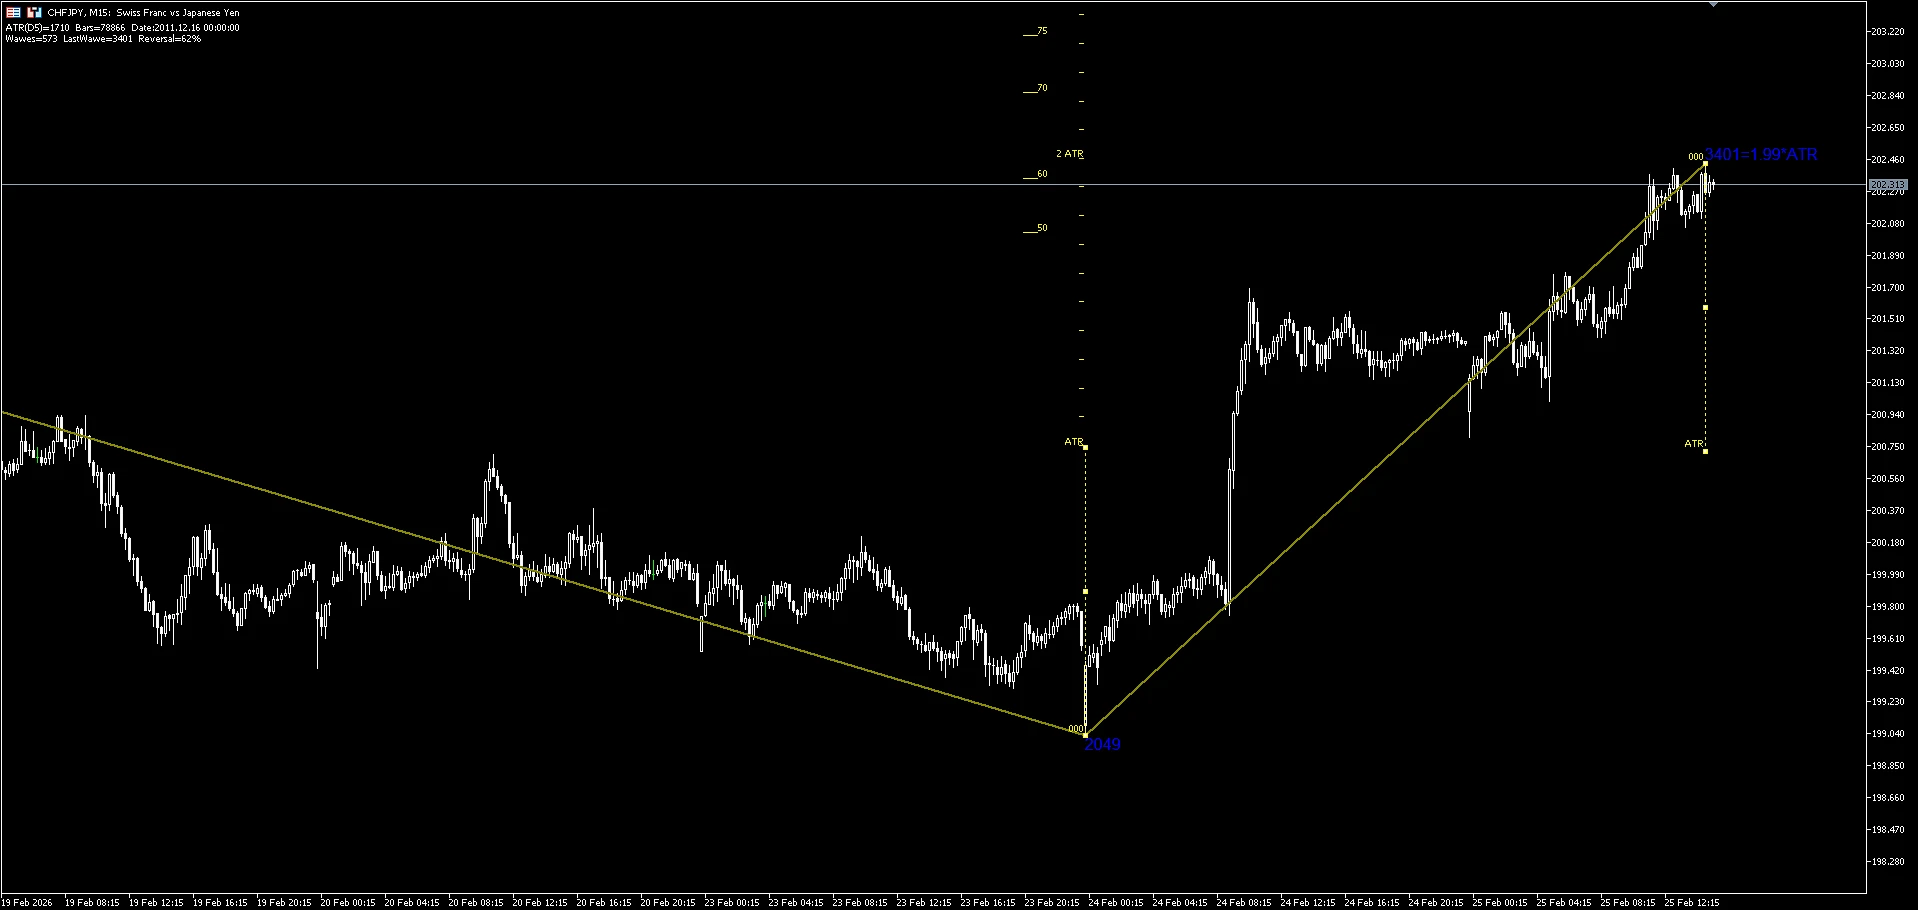
Step 5. Compare the Current Move With All Historical Ones
When the market has already traveled a long distance, the system checks:
-
how “typical” this move is based on history,
-
or whether it’s “rare/abnormal.”
And then it outputs the probability via a scale.
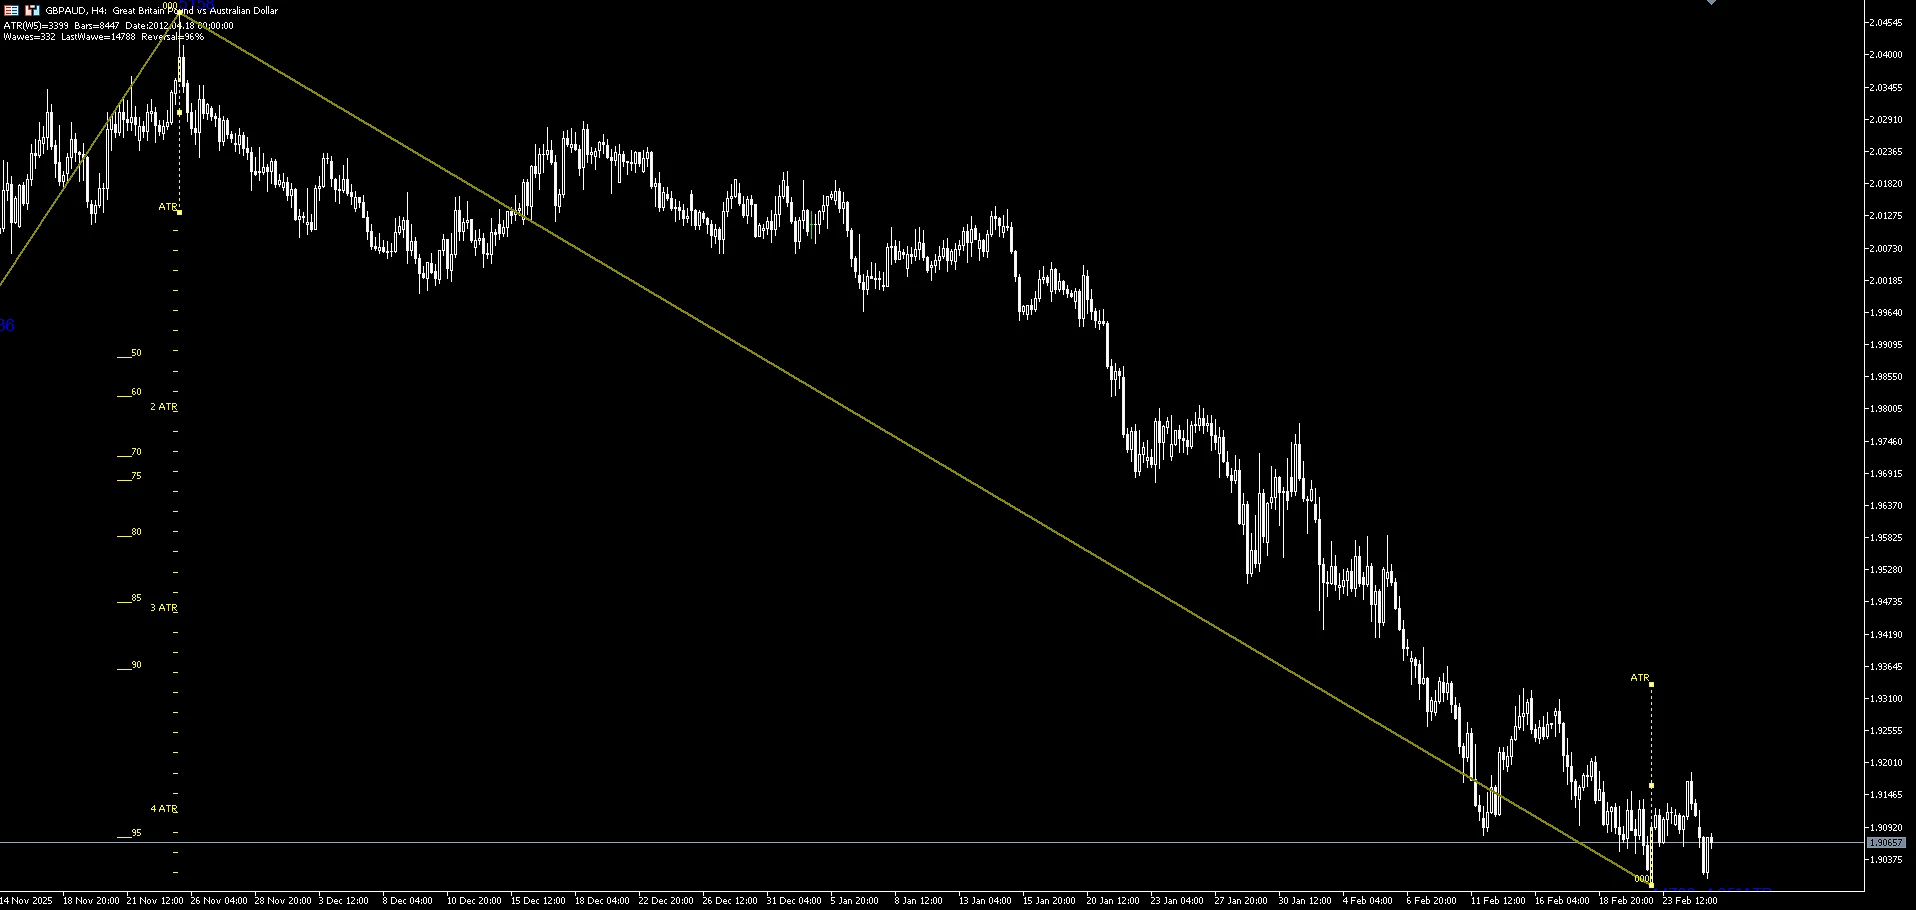
Why It Looks Like a “Probability Scale”
The idea of the scale is simple:
-
the farther price moves away from the “norm” (ATR),
-
the rarer such moves are in history,
-
the higher the probability that the market will at least partially “return” (produce a correction).
How This Differs From Trying to “Guess the Reversal”
Typical “by eye” trading looks like this:
-
“price has already risen a lot — time to sell”
-
“price has already fallen a lot — time to buy”
The quantitative approach looks different:
-
“based on history, after moves of this size a 1 ATR correction occurred in 62% of cases”
-
“so there is a statistical basis to look for a correction scenario”
-
“and I choose the entry point with separate trading logic”
In other words, quantitative analysis does not draw a BUY/SELL button.
It answers the question:
“Is there a statistical edge here, and what scale of correction is most likely?”
How to Use This Correctly
Quantitative analysis is a filter and a guideline, not a ready-made trade.
In practice, it works like this:
-
You find an instrument where the correction probability is high (for example, >70% or >85%).
-
You understand “over what distance” the market most often corrects (by the daily, weekly, or monthly ATR).
-
Then you look for an entry using your own strategy (structure, levels, pattern, confirmation).
-
You set targets and expectations not “from your head,” but from ATR logic and statistics.
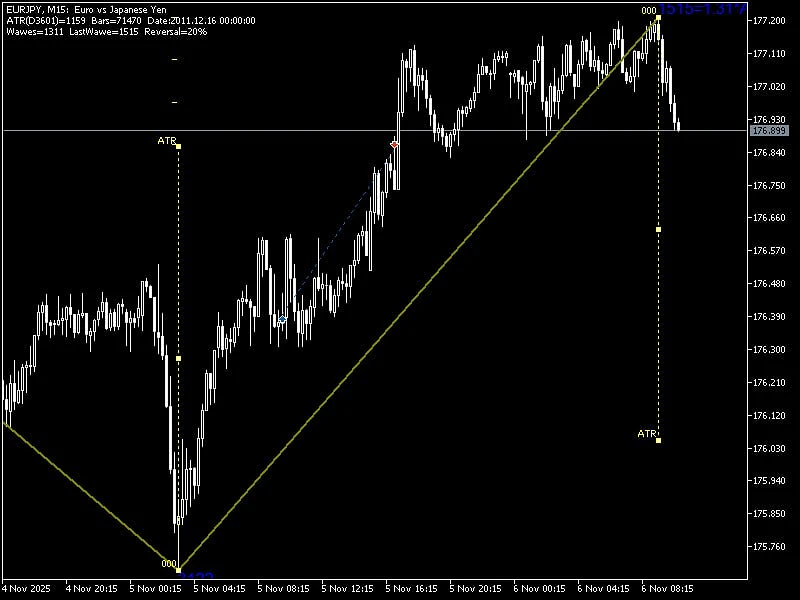
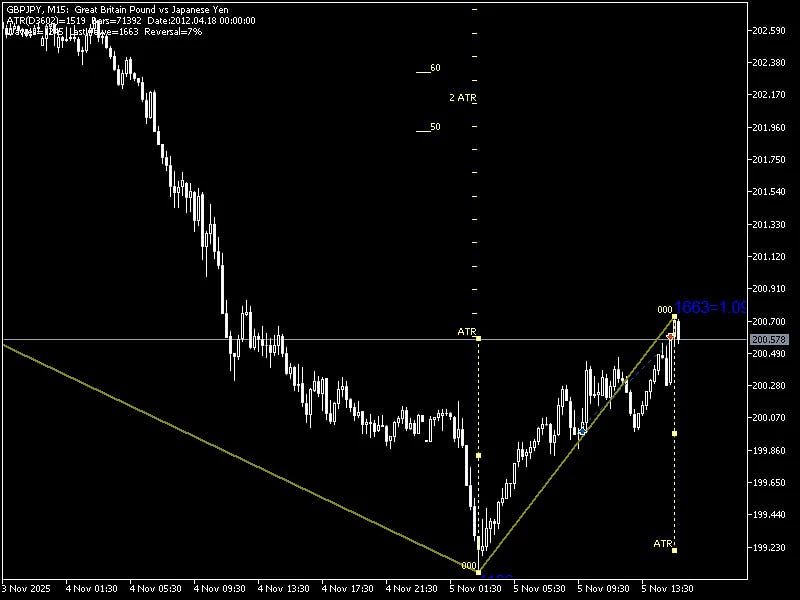
Example:
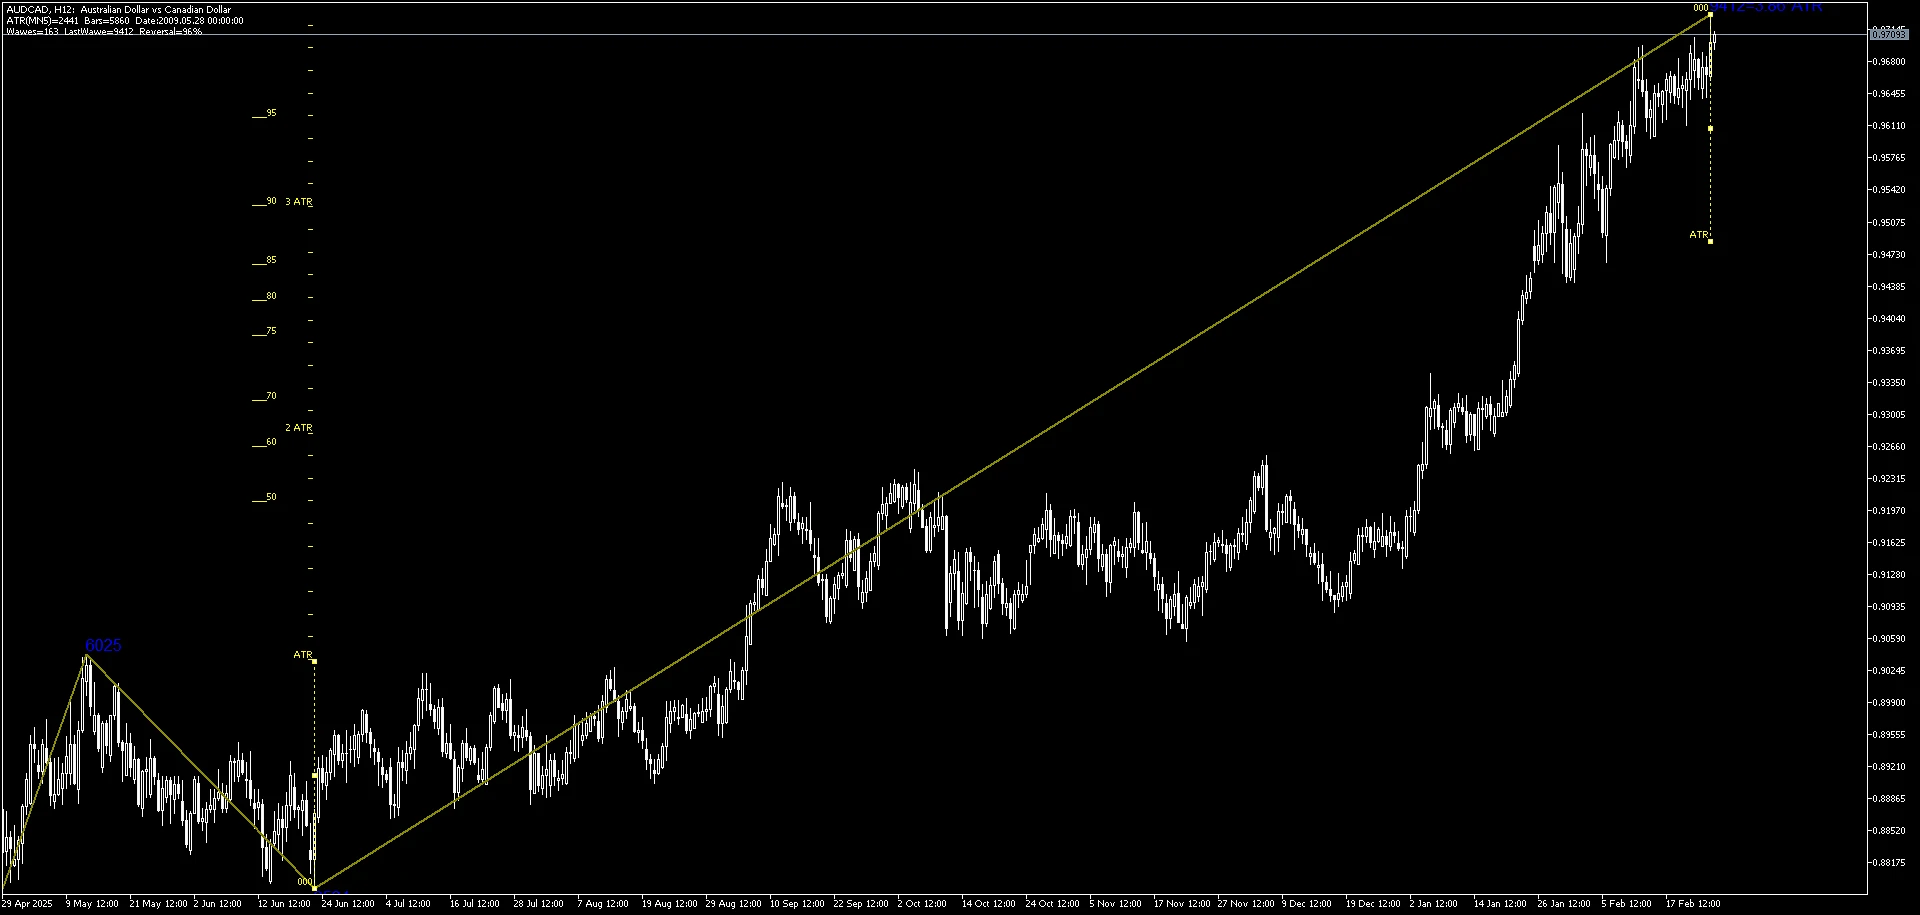
Trade Examples:
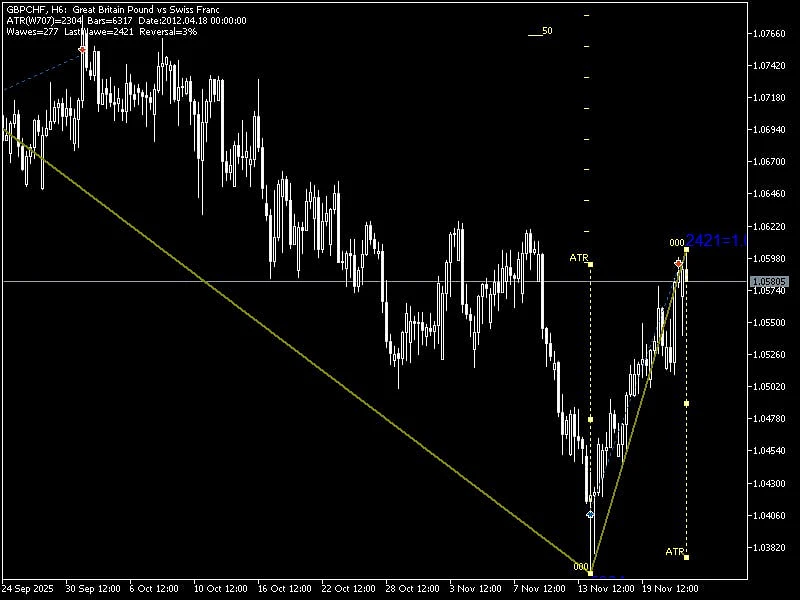
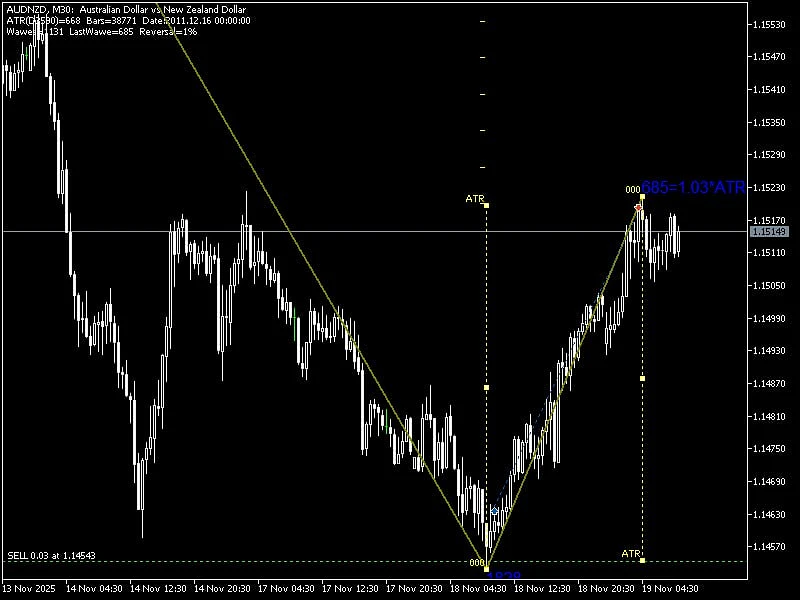
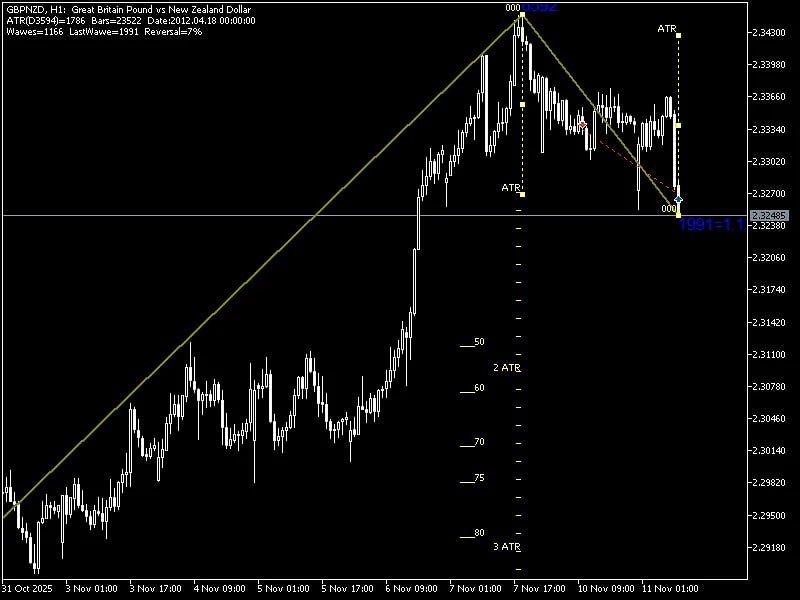
Important Note: Probability Is Not a Guarantee
Even if the probability is 90%:
-
the market may correct later,
-
it may produce a smaller correction,
-
or it may continue the trend and “run” even farther.
But the point is different: you stop trading “by feel” and start trading where, historically, the scenarios you need happen more often.
🎁 Bonus for GlobeGain Clients
If you are a GlobeGain client and receive rebates with us, this indicator is available for free for the MT4 and MT5 platforms. Contact us at support@globegain.com .