



- What a Forex chart actually shows
- Chart analysis is a context tool
- What patterns and indicators cannot establish
- Why false signals occur
- Testing a method without overstating what it proves
- Connect chart context to risk controls
- Broker conditions are separate from chart interpretation
- A disciplined way to use technical analysis
- What a Forex chart actually shows
- Chart analysis is a context tool
- What patterns and indicators cannot establish
- Why false signals occur
- Testing a method without overstating what it proves
- Connect chart context to risk controls
- Broker conditions are separate from chart interpretation
- A disciplined way to use technical analysis
What Technical Analysis Can and Cannot Tell Forex Traders
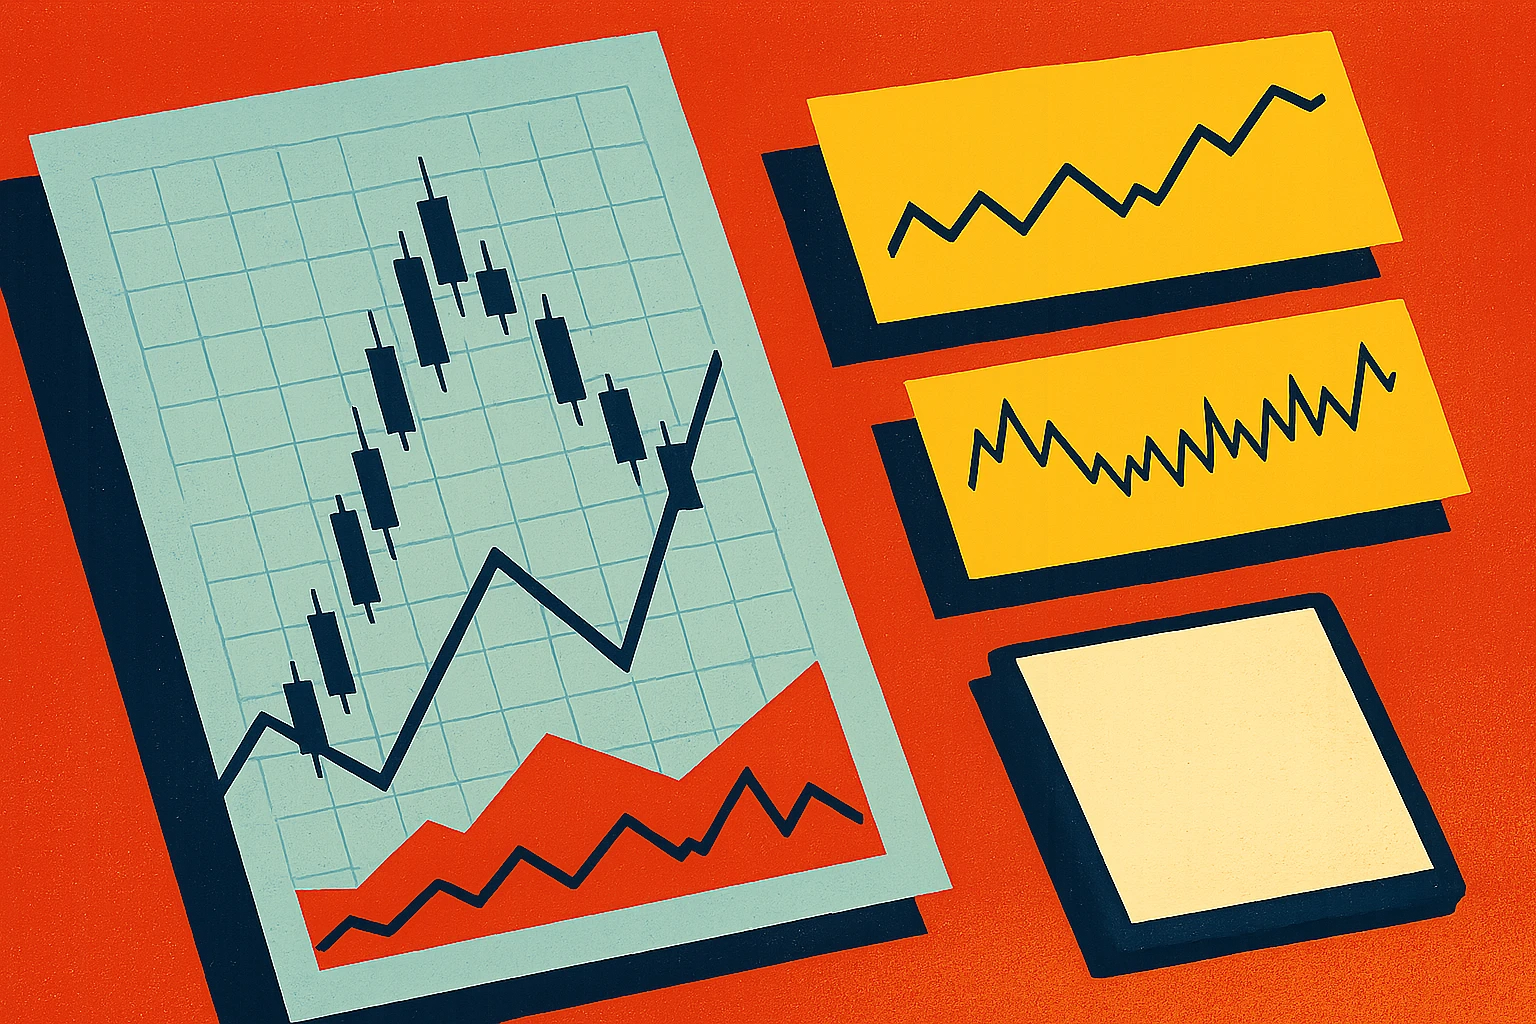


Technical analysis can help Forex traders describe what prices have been doing. It cannot establish with certainty what prices will do next. A trend line, candlestick pattern or indicator is a way to interpret past and current market behaviour, not proof of a future outcome. Used carefully, chart analysis can provide context for research and risk planning. Used as a prediction machine, it can create false confidence.
This distinction matters in spot Forex and Forex CFDs, where prices respond to changing expectations, economic information, liquidity and order flow. A chart shows recorded prices from a particular source and time period. It does not show every reason behind a move, guarantee that quoted prices are identical across providers, or ensure that a trade can be opened or closed at a chosen price.
What a Forex chart actually shows
A price chart arranges observations over time. Depending on its settings, each candlestick may summarize an interval’s opening, high, low and closing prices. The chart can make repeated behaviour easier to notice: a currency pair may have moved in a sustained direction, traded within a range, or become more volatile. These are descriptions of observed price action, not explanations of its cause.
Technical tools transform that price history into a visual framework. A moving average smooths past prices; a support or resistance area marks a zone where price has previously paused or turned; a momentum indicator summarizes the pace or direction of recent movement. These tools may help a trader ask consistent questions, such as whether a market has been directional or choppy. They do not add independent knowledge of future events.
Even the underlying data deserves attention. Forex is a decentralized market, and a retail platform generally displays prices supplied by its provider or liquidity sources. Different providers can show small differences in quotes, spreads, candles or historical data. A pattern found on one chart may therefore look slightly different on another. This does not make chart analysis useless, but it means that a chart is a representation of a market, not a universal record with identical details everywhere.
Chart analysis is a context tool
Context is the main practical value of technical analysis. A trader can use a chart to describe the recent market environment before considering any decision. For example, a chart may show that price has been moving persistently in one direction, oscillating inside a broad area, or making larger and less orderly swings. Those descriptions can inform how uncertain conditions appear and which questions deserve further investigation.
Timeframe changes the context. A brief chart interval can show noisy fluctuations that are barely visible on a longer interval. A broad trend on a daily chart can coexist with sharp counter-moves on a shorter chart. Neither view is automatically the correct one: they answer different questions. Traders should be clear about the period they are analysing and avoid treating a pattern from one timeframe as though it describes every holding period.
Technical observations can also help organize a review. A trader might record whether a market has been trending, whether volatility has expanded, or whether a prior level has been crossed and then revisited. Such notes are more useful when they use defined terms and a consistent method. Calling any movement that supports a preferred view a confirmation, while ignoring contradictory movement, turns chart reading into selective storytelling.
What patterns and indicators cannot establish
A familiar chart pattern does not have a guaranteed outcome. A breakout can fail, a support area can give way, and a trend can lose momentum without warning. The name assigned to a formation does not cause price to behave in a particular way. Patterns are interpretations made after observing price, and two analysts can reasonably disagree about where a pattern begins, whether it is complete, or whether it is meaningful at all.
Indicators have limitations that follow from how they are built. Many use past prices, so their readings can change only after price has moved. Smoothing may make a trend easier to see, but it can also make a change appear late. Oscillators can remain at an extreme while a strong move continues. A reading described as overbought or oversold is not, by itself, evidence that a reversal is due.
Using several indicators does not necessarily provide several independent confirmations. If multiple tools are calculated from the same price history, they may repeat similar information in different forms. Agreement among them can feel persuasive without adding much new evidence. A trader should understand what each tool measures and avoid counting correlated readings as though they were separate proof.
Technical analysis also cannot reliably identify the full cause of a price move. A sudden change may reflect economic news, changing interest-rate expectations, political developments, market positioning or a shift in liquidity. A chart can record the resulting movement, but it may not reveal which explanation is correct. Fundamental information and technical context address different questions; neither removes uncertainty.
Why false signals occur
False signals are not unusual exceptions that invalidate all chart analysis. They are an inherent possibility whenever decisions are based on uncertain patterns. In a range-bound market, a brief move beyond a visible boundary may reverse. In a fast market, a price may pass a watched level before conditions settle. In quieter conditions, small fluctuations can resemble meaningful changes when viewed on a short timeframe.
Market conditions can also change. A method that appeared useful during a sustained directional period may behave poorly when price becomes irregular or range-bound. A historical pattern can be affected by the dates selected, the instrument, the timeframe and the rules used to define it. Results from one period do not establish that the same relationship will persist in a different environment.
Human judgement adds another source of error. Traders may notice patterns more readily after seeing how a move ended, reinterpret unclear rules to fit a preferred conclusion, or focus on successful examples while forgetting failures. This is why hindsight can make a chart look more predictable than it was in real time. Written definitions and records of decisions can help reveal whether a method is being applied consistently, though they cannot guarantee better outcomes.
Testing a method without overstating what it proves
Historical testing can help examine whether a clearly defined chart-based idea would have behaved as expected in past data. The rules need to be specific enough that another person could apply them in the same way. If the rules are adjusted repeatedly until the history looks favourable, the result may reflect overfitting: the method has been shaped around past observations and may not generalize.
A realistic review should account for trading costs and execution assumptions. Forex spreads can vary, and commissions, financing charges, slippage and other applicable costs can affect results. A historical test that assumes every transaction occurs at an ideal price can overstate how usable a method would have been. Demo or simulated testing also cannot fully reproduce all live conditions, including the emotional pressure of risk and the possibility of changing execution quality.
Past performance, including a successful backtest, is not a promise about future performance. Testing is best understood as a way to find weaknesses, check consistency and make assumptions visible. It cannot rule out new market conditions or prove that a trader will follow the same rules when prices move quickly.
Connect chart context to risk controls
Risk controls address a different problem from chart analysis. A chart may help someone describe uncertainty, but it cannot make a position safe. Before taking exposure, a trader needs to understand the possible loss, the effect of leverage and the conditions under which a position could be closed. The size of a potential loss depends on the position and market movement, and leveraged Forex or CFD trading can magnify both gains and losses.
Stops and other exit instructions can be part of a risk plan, but they are not guarantees of a particular fill price. In fast or illiquid conditions, execution can differ from the requested level. A gap or rapid price change may mean that an order is filled at a less favourable price, subject to the provider’s execution arrangements. Risk planning should recognize this possibility rather than treating a line on a chart as a firm boundary.
Position sizing, limits on total exposure and a clear process for reviewing a trade can help keep a single chart interpretation from dictating an outsized decision. These controls do not eliminate loss. They make the consequences of uncertainty more explicit and can discourage impulsive reactions to every fluctuation. No single method is suitable for every trader, and risk tolerance and financial circumstances differ.
Broker conditions are separate from chart interpretation
When comparing Forex or CFD providers, chart analysis should not be confused with the quality or cost of execution. Check how the provider describes spreads, commissions, financing, order handling and the possibility of slippage, as well as which price feed and charting tools are available. Product terms and costs can differ, so claims should be checked against current provider documentation rather than inferred from a chart.
Cashback or other trading incentives, where offered, do not improve a technical signal or remove trading risk. They should be assessed as a separate condition, including any eligibility rules and how the benefit is calculated. A lower apparent cost or incentive does not make a weak analysis reliable, and activity undertaken to qualify for an incentive can still result in losses. GlobeGain’s educational material can help readers frame questions when comparing broker and cashback conditions, but the comparison does not replace checking the relevant terms directly.
A disciplined way to use technical analysis
A practical approach is to treat chart observations as conditional descriptions rather than instructions. State what the chart appears to show, note what could contradict that reading, and distinguish observation from interpretation. Ask whether the conclusion depends on a particular timeframe, indicator setting or price provider. Consider relevant economic and market context without assuming that news can be fully anticipated or that a chart can explain it afterward.
Then evaluate the consequences of being wrong. A plausible-looking pattern is not enough reason to ignore position risk, execution costs or leverage. If the interpretation is unclear, that uncertainty is itself useful information; it is not a requirement to act. Reviewing decisions later can help identify whether the analysis was consistent, whether costs were considered and whether the outcome depended on assumptions that were not realistic.
Risk reminder: Forex and CFD trading involves substantial risk and may not be suitable for everyone. Leverage can magnify losses, and chart patterns, indicators, historical tests and risk controls cannot guarantee a result or prevent loss. This article is educational information, not individualized financial advice or a trading recommendation.