

- What the indicator is about
- Who created WeisWave
- Does the indicator work in MT4 if it uses tick volume?
- How to read WeisWave (in simple terms)
- How to use it in trading
- Important: WeisWave doesn’t give ready-made signals
- Indicator settings (what really matters)
- WeisWave pros
- Cons
- Conclusion
- Download WeisWave MT4 indicator
WeisWave Indicator MT4 — how to understand market strength through volume


Most traders look only at price and try to guess the direction. But the market doesn’t move “just because” — behind every impulse there is effort from participants. And that effort is exactly what helps you see the WeisWave Indicator.
This tool doesn’t draw “BUY/SELL” arrows and doesn’t try to predict the future. Its job is to show who is really moving the market: buyers or sellers, and how strong that movement is.
What the indicator is about
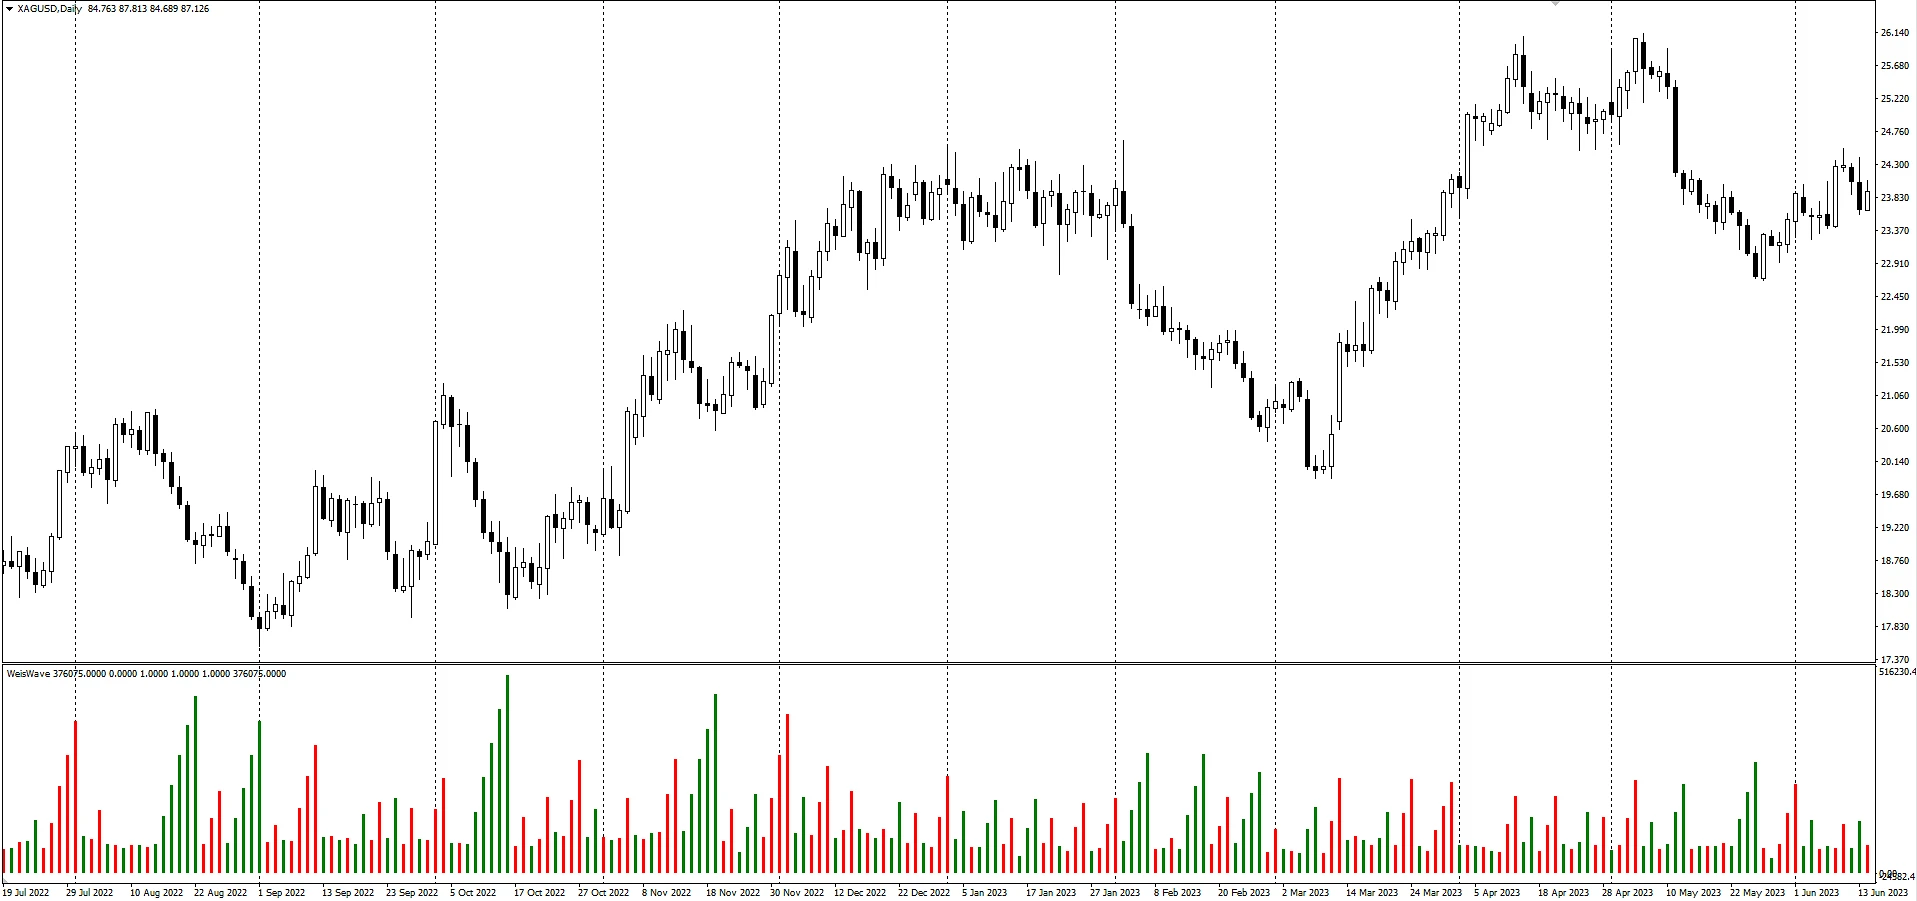
(XAGUSD chart)
WeisWave is based on supply-and-demand logic.
Simply put, the indicator breaks the chart into waves:
-
up waves (buyers building positions)
-
down waves (selling pressure)
Then it calculates the total volume inside each wave and displays it as a histogram under the chart.
So we don’t see separate volume spikes — we see the overall effort the market needed to make the move.
That’s what distinguishes WeisWave from classic Volume.
Who created WeisWave

The idea was developed by analyst David Weis, who adapted Richard Wyckoff’s methods.
The approach is simple:
➡️ price is the result
➡️ volume is the effort
If effort is big but price progress is weak — it means there’s a struggle in the market.
If price moves easily on small volume — the move may be unstable.
Does the indicator work in MT4 if it uses tick volume?
This is a common question.
Yes, it works. Even though MetaTrader uses tick volume rather than real exchange volume, it still reflects market activity. For analyzing the strength of a move, that’s usually enough.
How to read WeisWave (in simple terms)
Imagine volume is fuel.
-
a big bullish wave + high volume → strong demand
-
a bearish wave with low volume → sellers are weak
-
rising volume without price progress → a possible reversal
The indicator helps you compare:
-
how long the wave lasted
-
how far price moved
-
how much volume was spent on the move
This comparison is what reveals the market’s character.
How to use it in trading
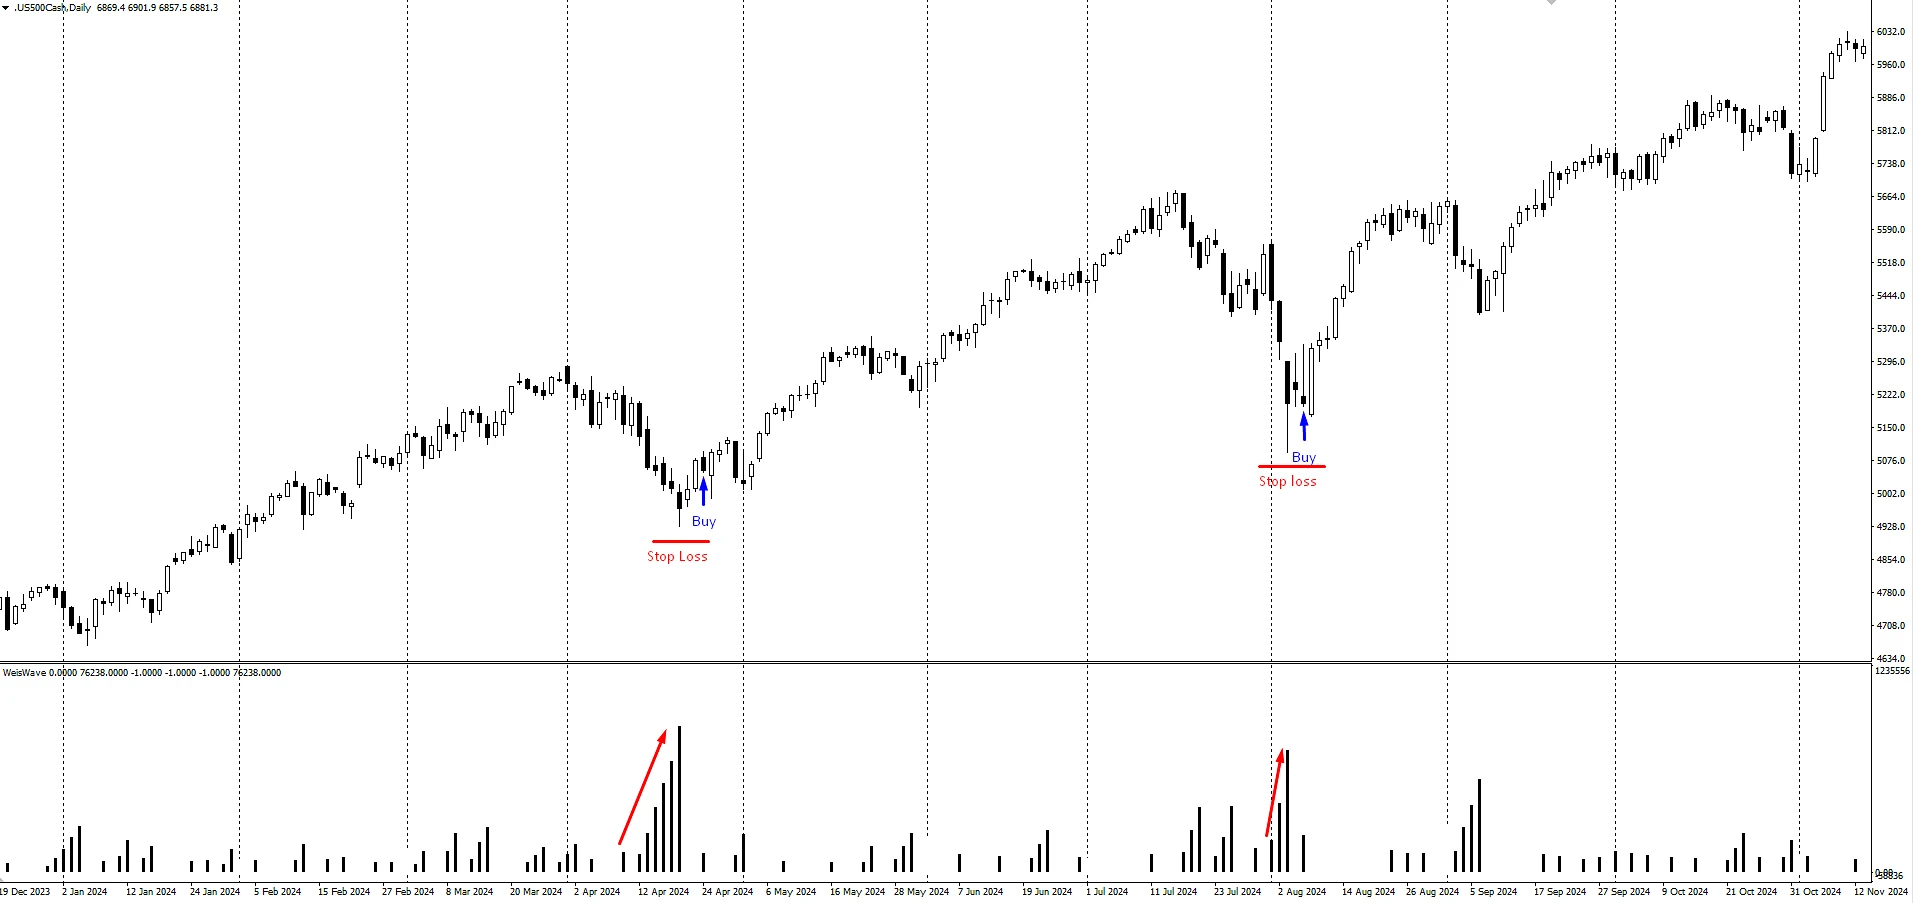
The scenario looks like this:
1️⃣ A strong upward wave forms — you see good price progress and high volume.
2️⃣ After it, a pullback appears, but volume is noticeably weaker.
3️⃣ A new upward wave starts — that’s a sign buyers still control the market.
Entry logic:
-
enter long after the new wave is confirmed
-
stop-loss — below the local low
-
manage the position — trail the stop as weak pullbacks form
The key is to always watch your risk/reward ratio.
Important: WeisWave doesn’t give ready-made signals
This isn’t a “press a button — get an entry” indicator.
It shows the market structure.
The trader makes the decision.
It’s best used together with:
-
support/resistance levels
-
RSI
-
trend lines
-
price structure analysis
Indicator settings (what really matters)
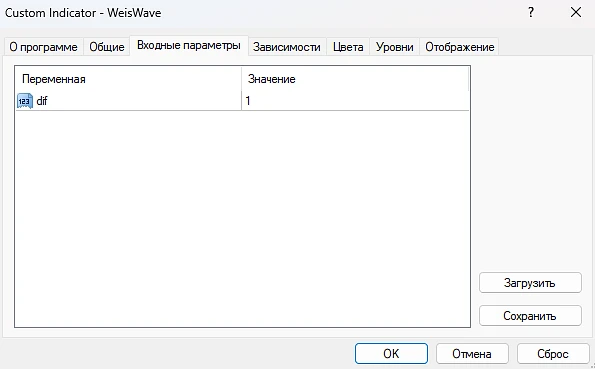
Dif (Difference)
The main indicator parameter.
It defines how far price must move against the current wave for the indicator to start counting a new one.
In other words:
-
a larger value → fewer waves, a smoother picture
-
a smaller value → higher sensitivity, more signals
Recommendation:
-
higher timeframes → increase the value
-
lower timeframes → decrease it
WeisWave pros
✔ helps you see the real balance of supply and demand
✔ suitable for Forex, stocks, and other markets
✔ works on any timeframe
✔ pairs well with other tools
✔ does not repaint
Cons
✖ no automatic signals
✖ requires practice and understanding of volume logic
✖ beginners need time to learn how to read the waves
Conclusion
WeisWave is a tool for those who want to understand the strength of a move, not just chase arrows on a chart.
It helps you see:
-
where the market moves easily
-
where participants spend a lot of effort without results
-
where control may shift between buyers and sellers
If you’re used to looking only at price, this indicator can seriously change how you see the market.
But like any tool, it’s best to test it on a demo first and only then use it in live trading.