

WaveTrend Oscillator for TradingView: a simple indicator that helps find market reversals


Many traders look for a clear and effective indicator for TradingView that helps find entry points without complex math and dozens of settings. One of these tools is WaveTrend Oscillator — a popular oscillator that shows moments when the market becomes overbought or oversold.
This indicator is widely used in cryptocurrencies, forex, indices, and stocks because it helps detect moments when the price may slow down, correct, or reverse.
What the WaveTrend indicator shows
WaveTrend is an oscillator that analyzes how strongly the price has deviated from its average value.
The market rarely moves in a perfectly straight line. When the price rises too fast or falls too sharply, it often makes a reverse move — a correction.
These are exactly the moments that WaveTrend tries to show.
The indicator helps answer two important questions:
-
is the market already overheated or is the move still continuing
-
is a reversal or correction possible
That is why many traders use WaveTrend as a tool for finding counter-trend entries or profit-taking points.
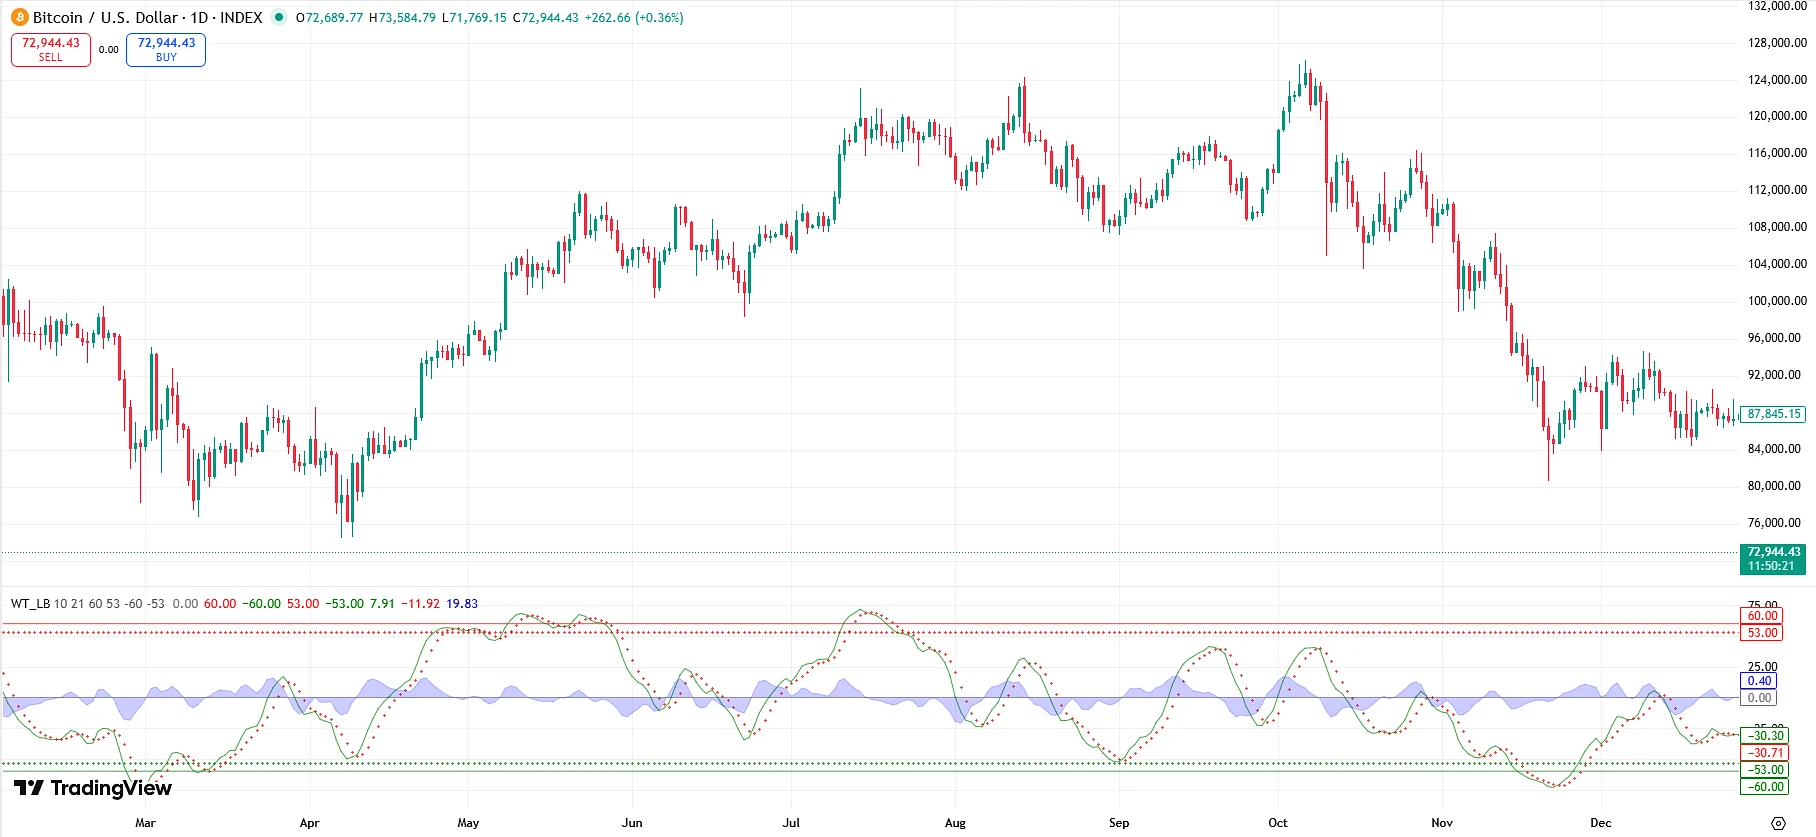
How WaveTrend looks on the chart
WaveTrend is displayed in a separate window below the price chart.
Inside the indicator there are:
-
the main indicator line
-
the signal line
-
overbought and oversold zones
When the indicator lines rise too high, the market is considered overbought.
When the lines fall too low, the market is considered oversold.
It is exactly in these zones that reversals or corrections most often appear.
Main WaveTrend signals
The indicator gives several types of signals that traders use for market analysis.
Buy signal
A signal appears when:
-
the indicator is in the oversold zone
-
the main line turns upward
-
the signal line is crossed
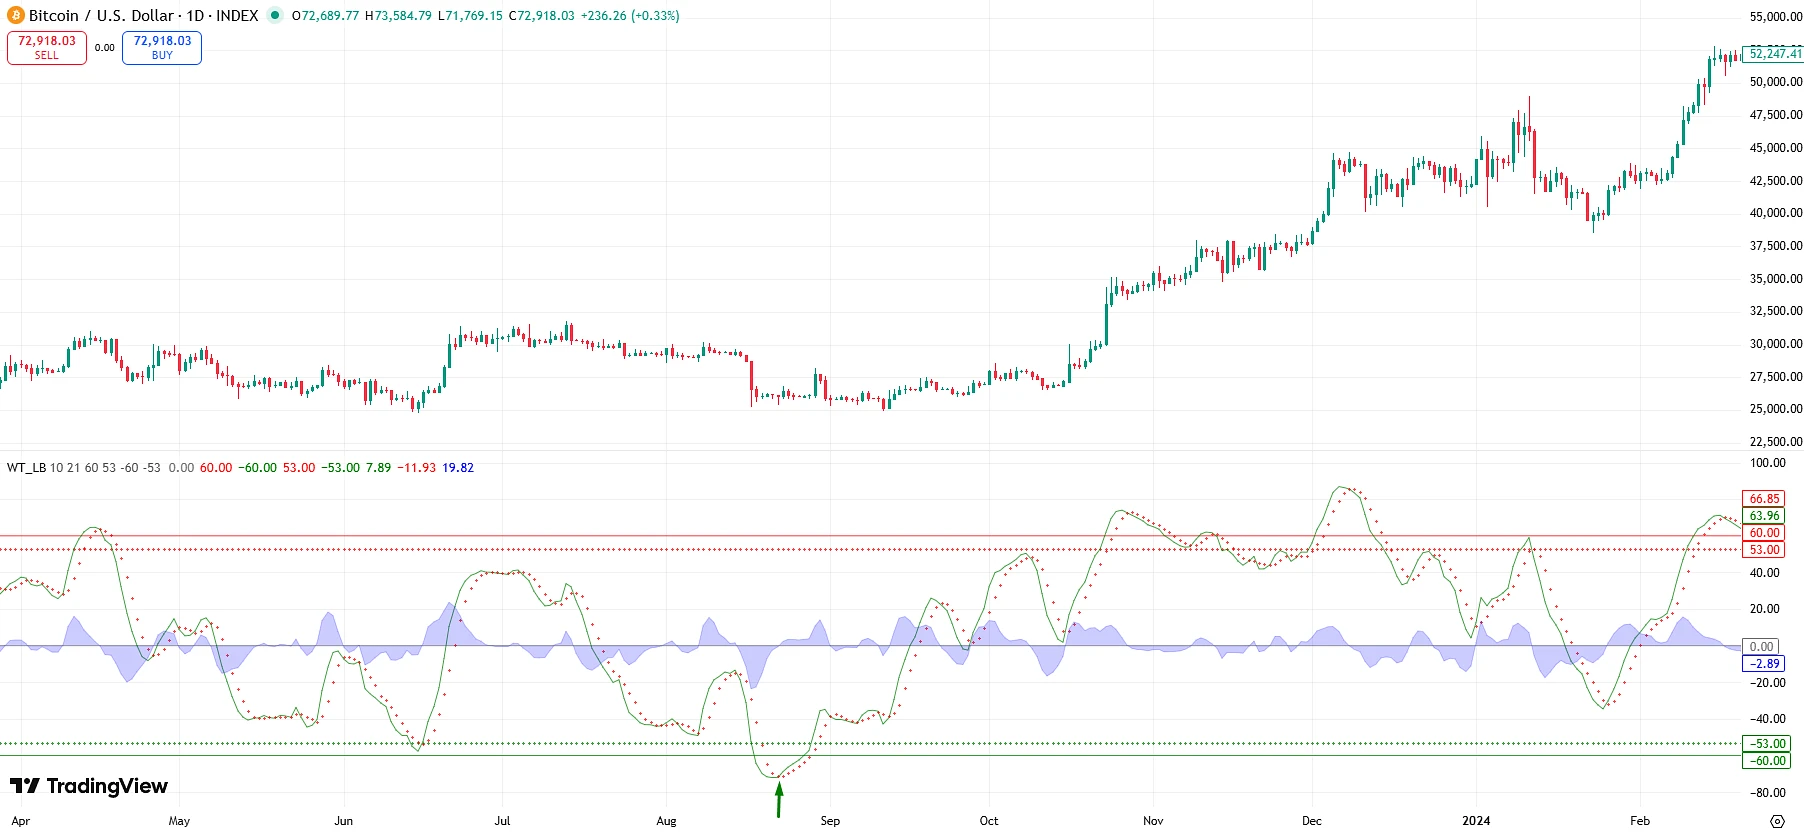
This means that sellers are starting to lose strength and the market may shift to growth.
Such signals often appear after sharp drops or strong downward impulses.
Sell signal
A signal appears when:
-
the indicator is in the overbought zone
-
the main line starts to decline
-
the signal line is crossed from top to bottom
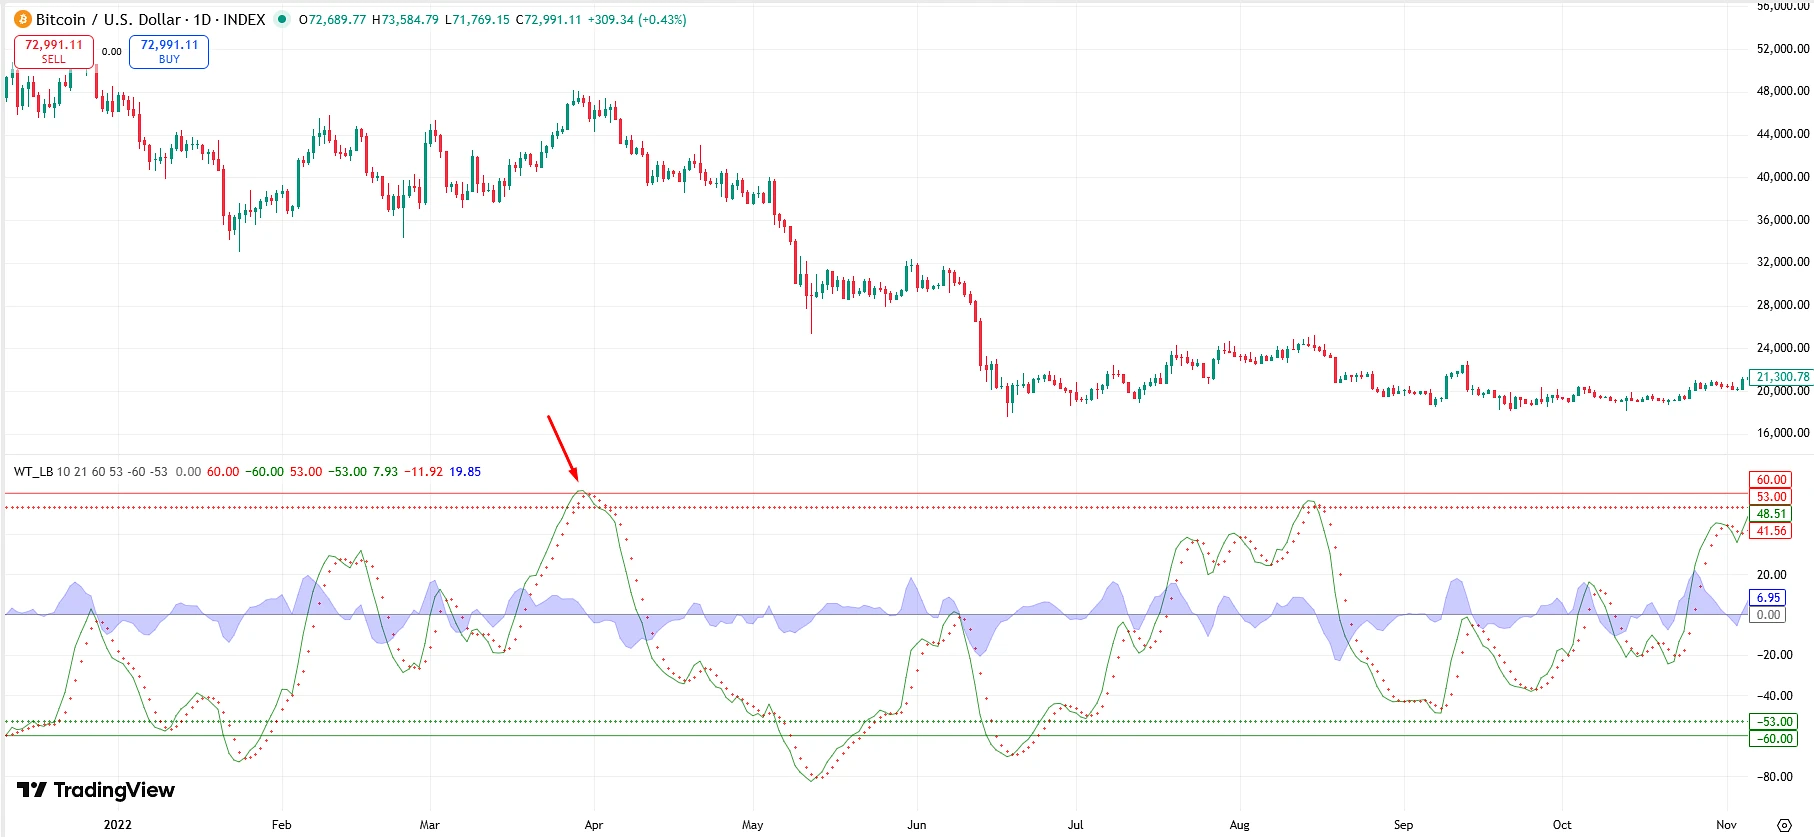
This may mean that buyers are starting to take profits and the market is ready for a correction or downward reversal.
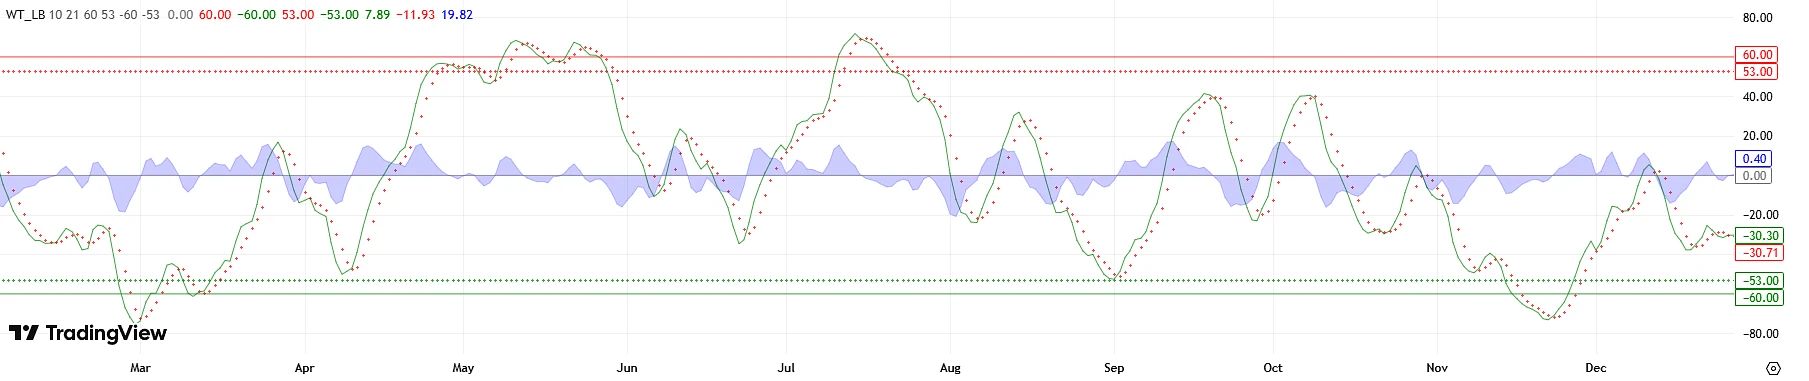
Overbought and oversold zones
WaveTrend uses special levels that help identify extreme market conditions.
When the indicator is in the upper zone, it means:
the market has risen too quickly and may start to correct.
When the indicator is in the lower zone, it means:
the market has fallen too sharply and a rebound upward is possible.
It is important to understand that this does not guarantee a reversal, but only shows an increased probability of a change in movement.
Why traders like WaveTrend
This indicator became popular for several reasons.
Simplicity
WaveTrend is easy to understand even for a beginner. There is no need to study complex formulas or rare patterns.
Versatility
It works in almost any market:
-
cryptocurrencies
-
forex
-
stocks
-
indices
Early signals
WaveTrend often shows early signs of trend weakening even before it becomes visible on the price chart.
Summary
WaveTrend Oscillator for TradingView is a convenient and easy-to-understand indicator that helps traders find potential reversals and market correction points.
It is especially useful for:
-
finding extreme market conditions
-
analyzing impulse moves
-
finding entry points after strong price moves
However, the best results are achieved when WaveTrend is used in combination with other technical analysis tools.
Then it becomes not just an indicator, but part of a complete trading system.
How to add WaveTrend Oscillator to TradingView
If you want to test this indicator on your chart, it can be added to TradingView in just a few seconds.
👉 Add the indicator to TradingView: Open WaveTrend Oscillator
After that, click the Add to Favorite Indicators button, and the indicator will appear in your list.
Where to test the WaveTrend strategy
This indicator is best tested in markets with good liquidity:
-
Forex
-
Crypto
-
Indices
-
Commodities
It is important to remember that with active trading, part of the profit may be lost to spreads and commissions.
That is why many traders use GlobeGain to get back part of their trading costs.