

- Support and resistance breakout indicator
- Main features of the indicator
- BUY and SELL arrow signals
- How to use the indicator in trading
- Signal filtering with RSI and CCI
- Main indicator settings
- Which timeframes the indicator works on
- Conclusion
- Download the Support Resistance Breakout Arrows indicator for MT5
Support Resistance Breakout Arrows — a support and resistance breakout indicator for MT5


Support and resistance breakout indicator
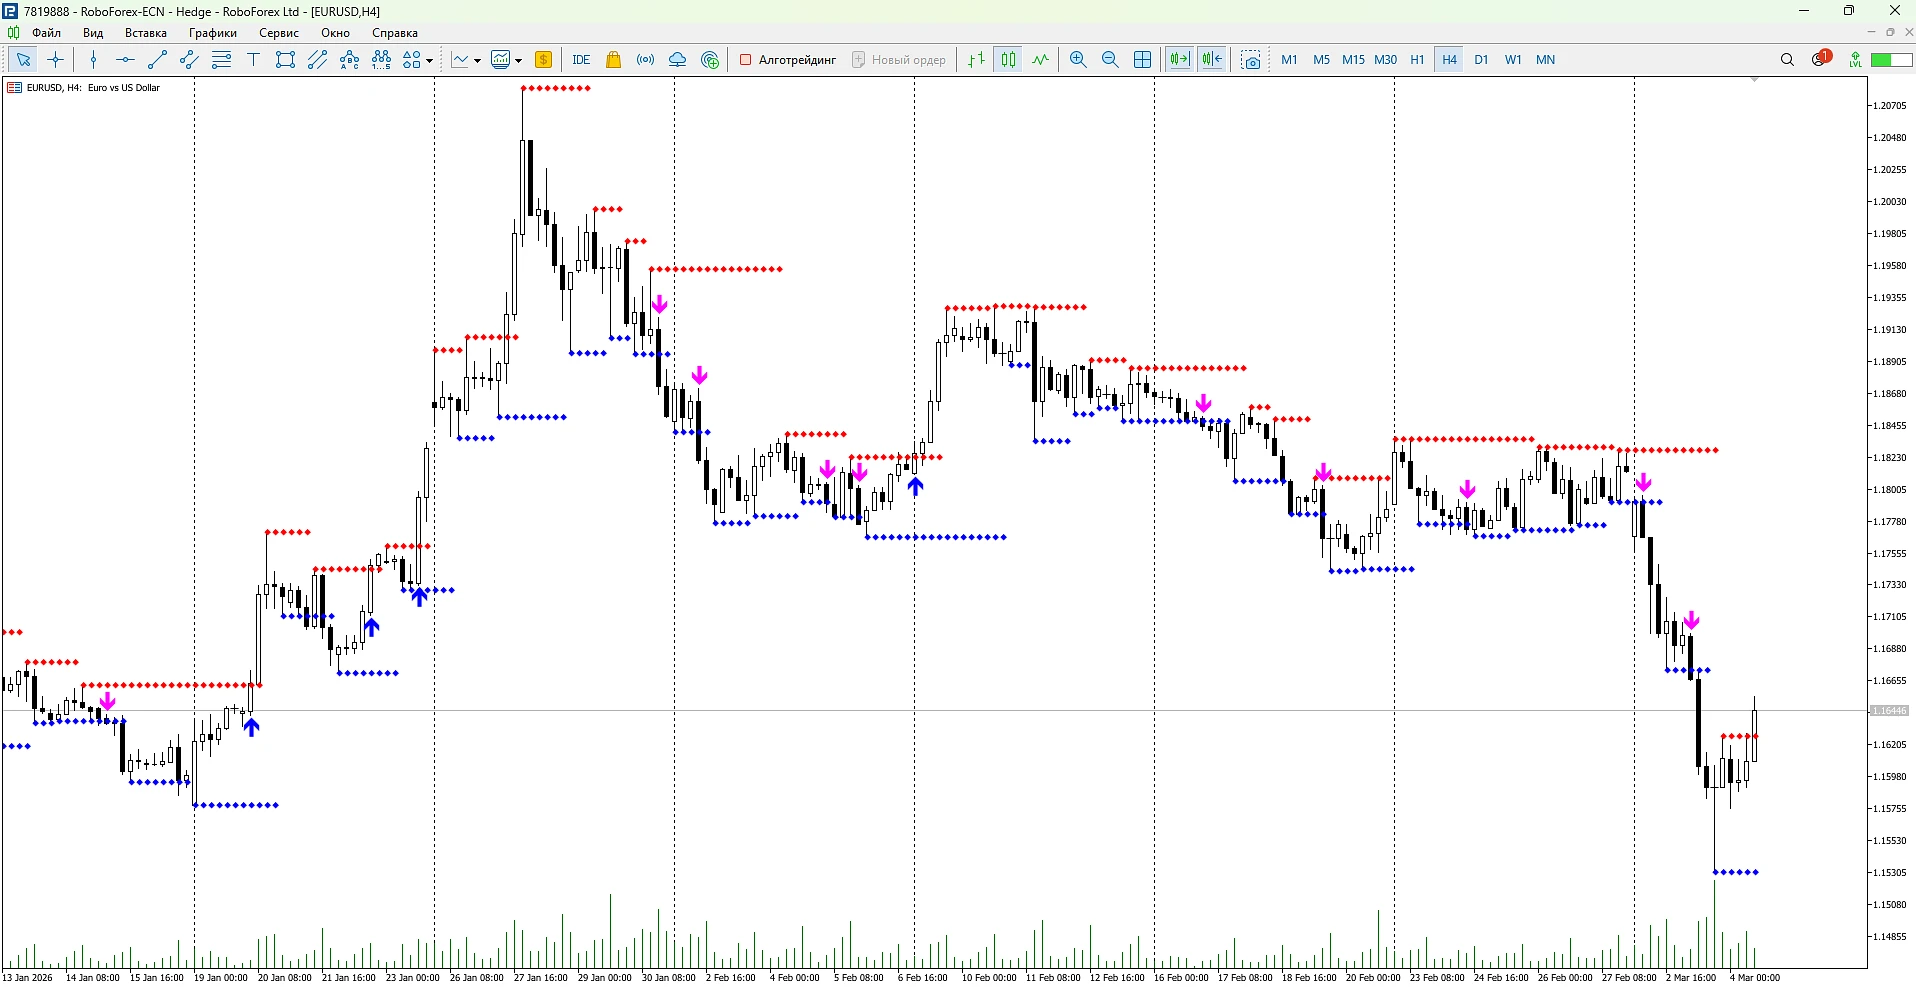
Support Resistance Breakout Arrows Indicator is a convenient technical indicator for MetaTrader 5, designed for traders who use support and resistance breakout strategies.
The indicator automatically identifies key Support and Resistance levels and also generates arrow buy and sell signals based on a combination of several popular analysis tools:
-
Fractals
-
RSI (Relative Strength Index)
-
CCI (Commodity Channel Index)
Because of this, the indicator helps traders quickly find potential market entry points and make decisions based on objective signals.
The indicator was developed specifically for MetaTrader 5, does not repaint signals, and is suitable for use on different timeframes.
Main features of the indicator
Support Resistance Breakout Arrows Indicator combines several technical analysis functions, making it a useful tool for both beginners and experienced traders.
Automatic detection of support and resistance levels
The indicator builds key levels automatically:
-
Support — highlighted in blue
-
Resistance — highlighted in red
These levels help traders:
-
find possible reversal zones
-
track potential breakouts
-
use levels for entries or adding to a position
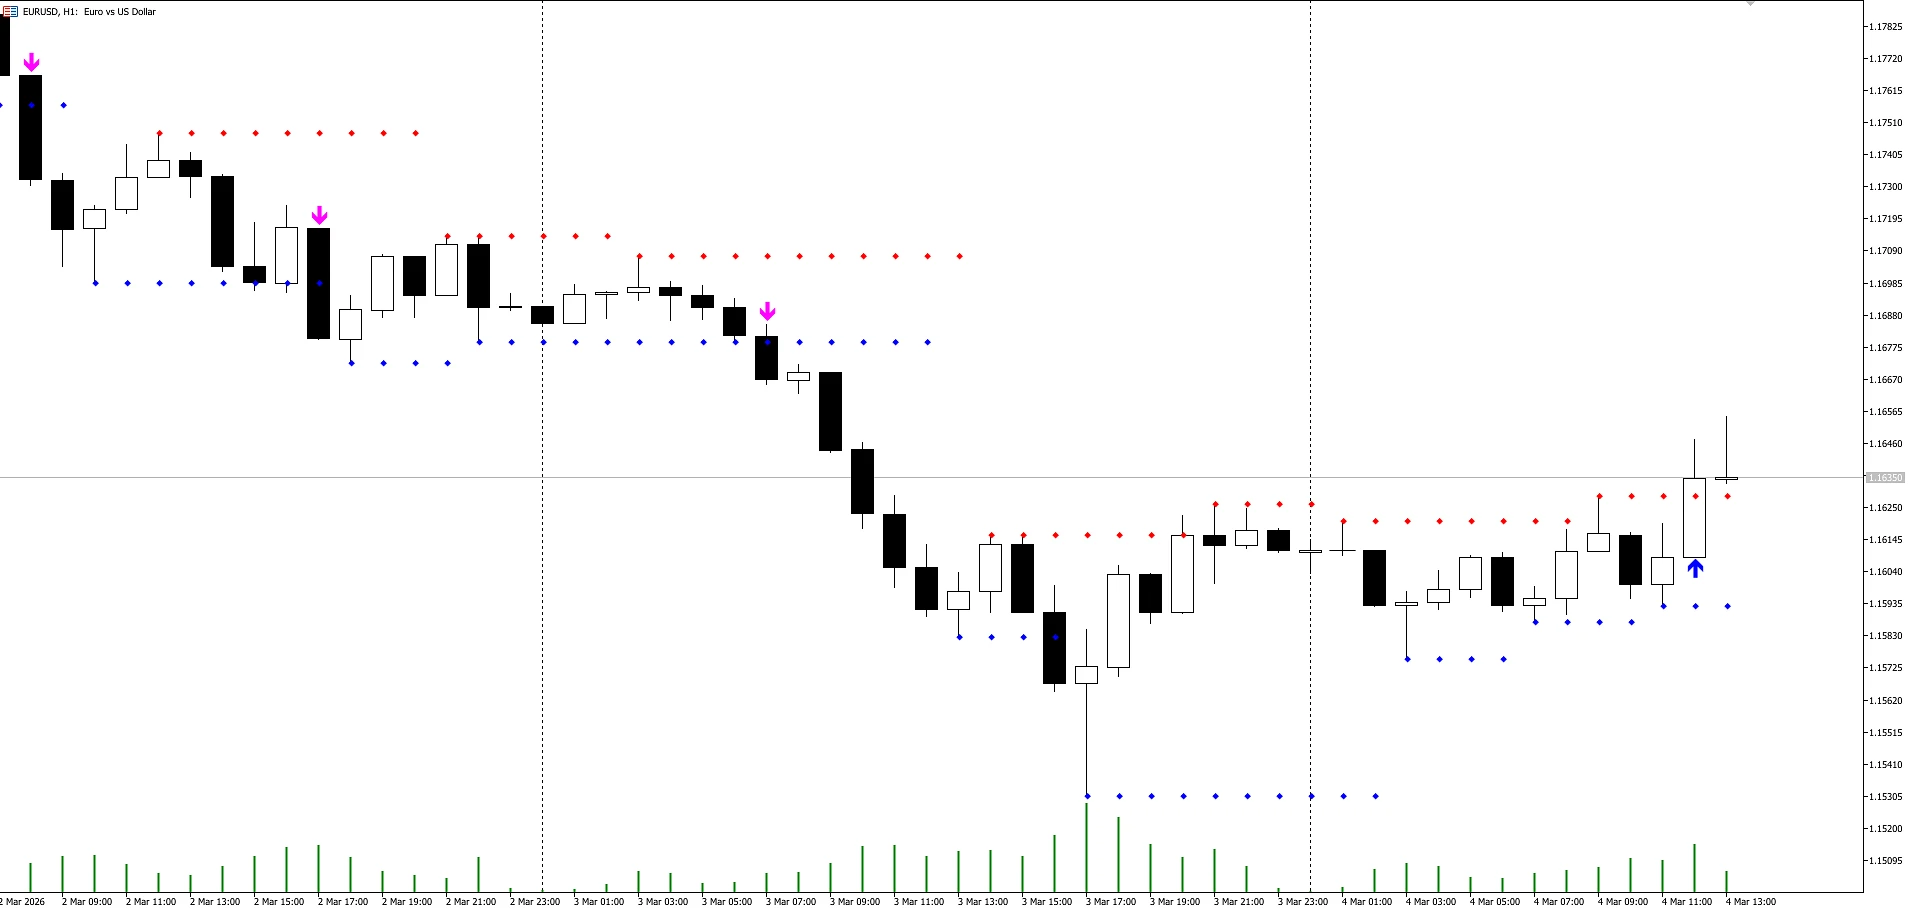
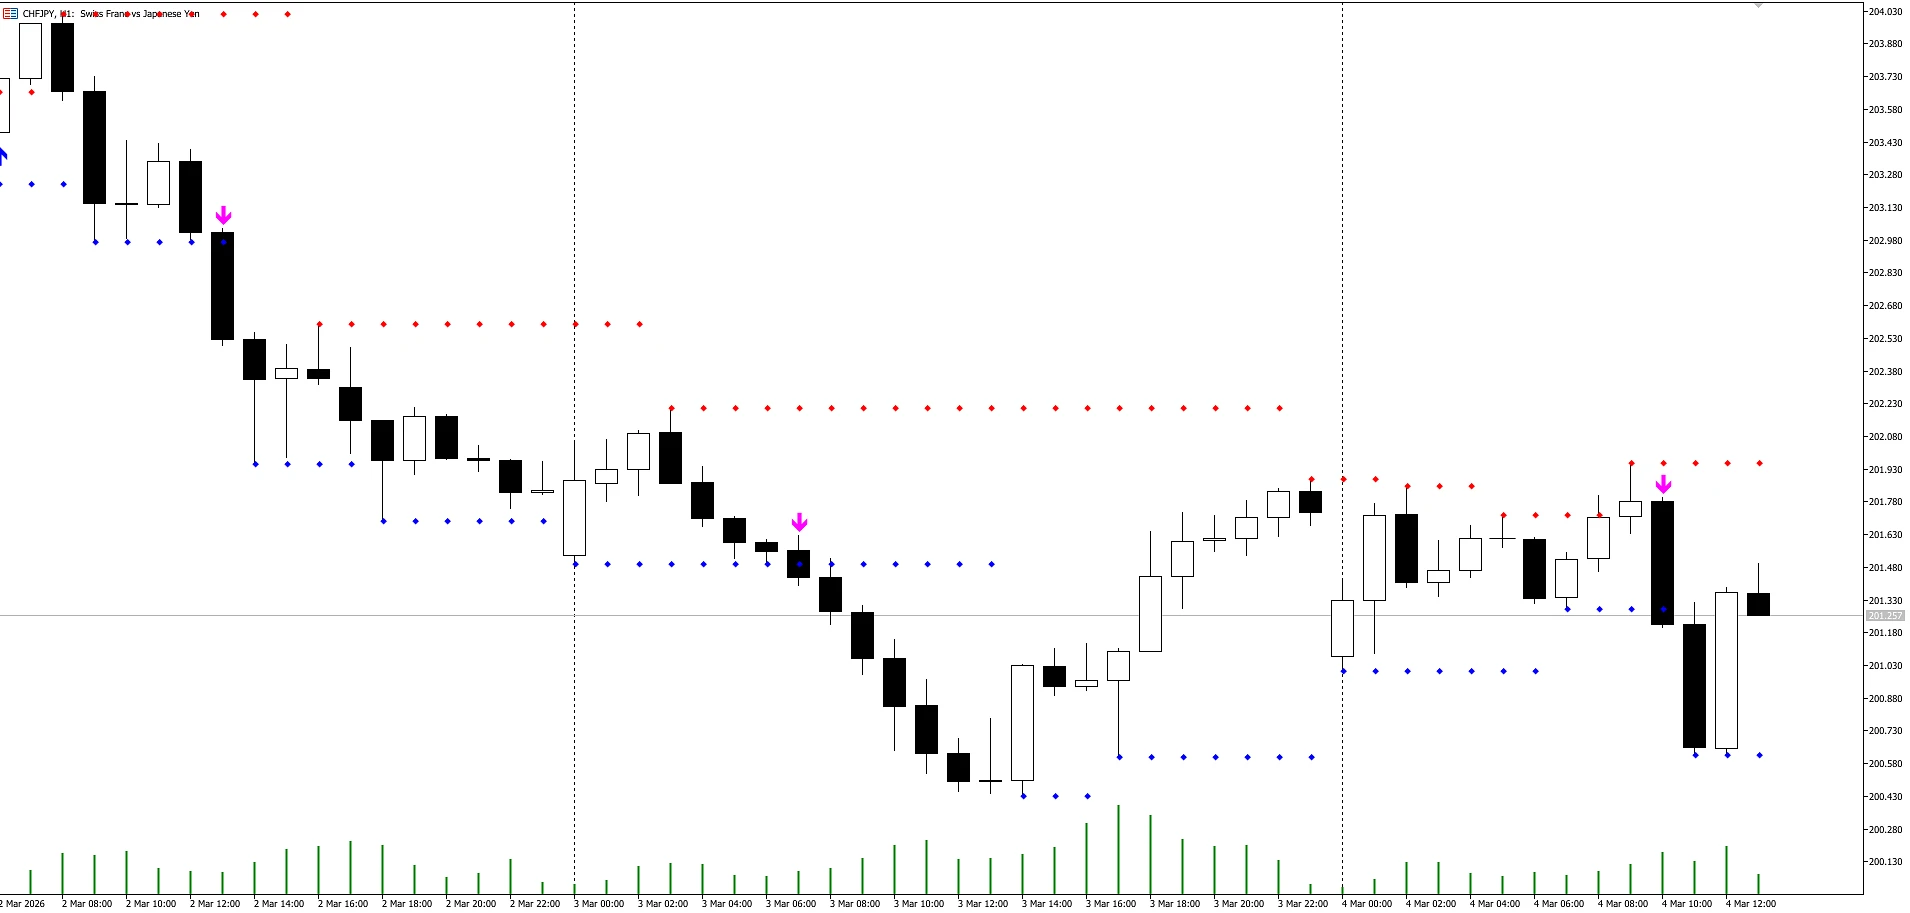
BUY and SELL arrow signals
The indicator displays signals as arrows:
-
Blue arrows — buy signal (BUY)
-
Purple arrows — sell signal (SELL)
Signals are formed based on a combination of Fractals + RSI + CCI, which helps filter out weak market moves.
During a strong trend, the indicator may show several signals in one direction, allowing traders to scale into a position gradually.
How to use the indicator in trading
Example of the basic logic of using the indicator:
Buy signal (BUY)
A buy can be considered when:
-
a blue arrow appears
-
the price is near a support level
-
the market shows signs of trend continuation
Some traders use a strategy of adding to the position on each new signal, closing all trades when an opposite signal appears.
Sell signal (SELL)
Sales can be considered when:
-
a purple arrow appears
-
the price is near a resistance level
-
a possible reversal or continuation of the downward move is observed
Signal filtering with RSI and CCI
One of the useful features of the indicator is additional signal filtering.
In the settings you can enable the filter:
-
RSI
-
CCI
This makes it possible to get stronger signals by filtering out weak market moves.
For example:
-
RSI helps determine overbought and oversold zones
-
CCI allows you to evaluate the strength of the current impulse
The combination of these indicators makes the signals more accurate.
Main indicator settings
Support Resistance Breakout Arrows Indicator has flexible parameters that can be adapted to different trading strategies.
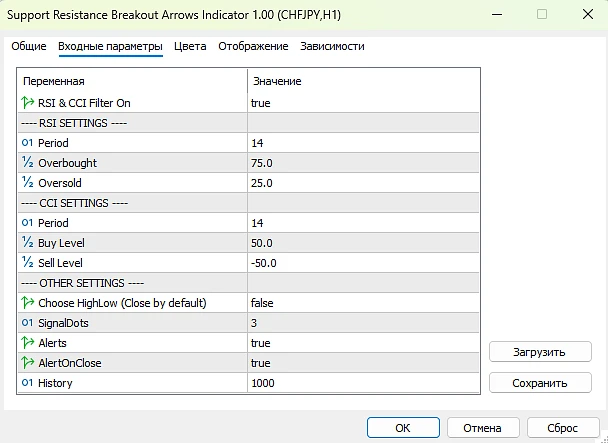
Signal filter
RSICCI_Filter
Enables signal filtering using RSI and CCI.
RSI settings
RSIPeriod
RSI calculation period.
RSIOverbought
Overbought level.
RSIOversold
Oversold level.
CCI settings
CCIPeriod
CCI calculation period.
CCIBuyLevel
Buy signal level.
CCISellLevel
Sell signal level.
Signal and alert settings
HighLow
Sends an alert when High or Low is broken.
SignalDots
Number of dots to confirm the signal.
Alerts
Enables sound alerts.
AlertOnClose
Sends a signal after the candle closes.
History
Number of bars for indicator display.
Which timeframes the indicator works on
The indicator can be used on different timeframes:
-
M5 – M30 — for scalping
-
H1 – H4 — for intraday trading
-
Daily and Weekly — for medium-term strategies
Thanks to its versatility, the indicator is suitable for both day traders and traders working on longer periods.
Conclusion
Support Resistance Breakout Arrows Indicator for MT5 is a convenient tool for automatically identifying key support and resistance levels and receiving trading signals.
The combination of Fractals, RSI and CCI helps filter market movements and find potential entry points.
Using the indicator together with market structure analysis and risk management can significantly improve trading efficiency.
The indicator is easy to install, suitable for different strategies, and can be used by traders of any experience level.
Download the Support Resistance Breakout Arrows indicator for MT5