

Squeeze Momentum Indicator for TradingView: how to find powerful market moves before they begin


Financial markets move in cycles. Periods of low activity are almost always followed by strong impulses. This principle is exactly what lies behind the Squeeze Momentum Indicator — one of the most popular indicators on the TradingView platform.
This tool helps traders identify moments when the market is building up energy before a strong move, allowing them to prepare for a potential impulse in advance.
The indicator became widely known thanks to developer LazyBear, who implemented the idea of the TTM Squeeze indicator described in John F. Carter’s book Mastering the Trade.
What the Squeeze Momentum Indicator shows
The main purpose of the indicator is to identify the moment when market volatility sharply decreases.
A drop in volatility often means that the market is in an accumulation phase before a strong move.
The indicator analyzes the interaction of two popular technical analysis tools:
-
Bollinger Bands
-
Keltner Channel
When the Bollinger Bands narrow and move inside the Keltner Channel, it means that the market is in a squeeze state.
This situation indicates that:
-
volatility is at a minimum
-
the market is preparing for a strong move
-
an impulse up or down may begin soon
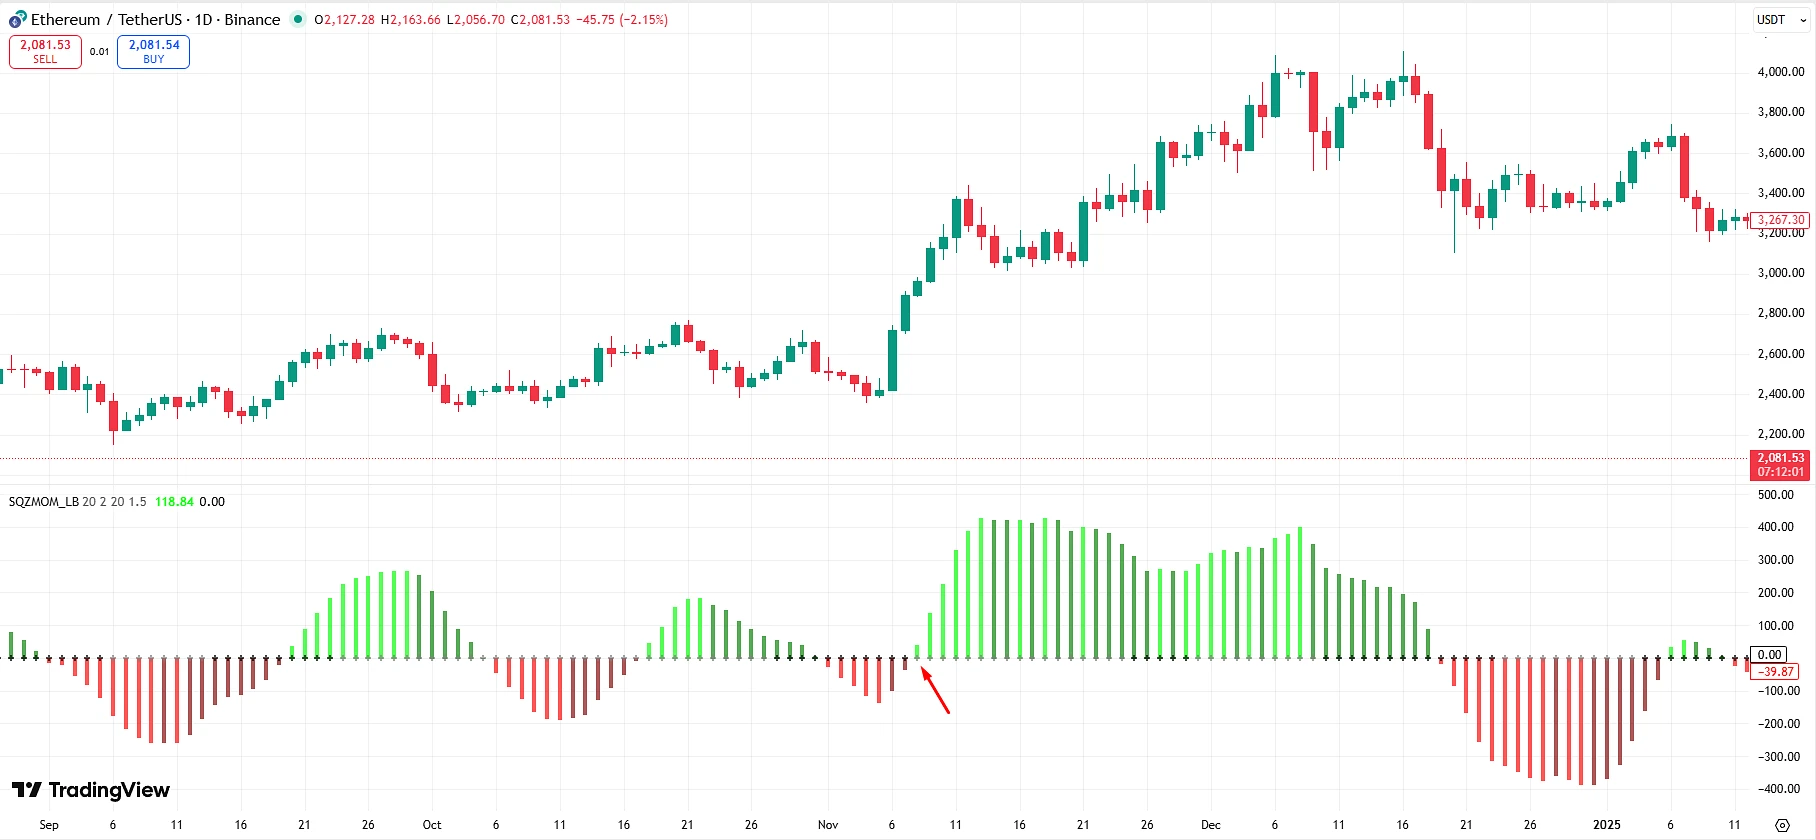
How to read the indicator signals
The indicator consists of two key elements.
Market condition dots
Dots of different colors appear on the central line.
Black dots
They mean that the market is in the squeeze phase.
This means:
-
the Bollinger Bands are inside the Keltner Channel
-
volatility is low
-
the market is preparing for an impulse
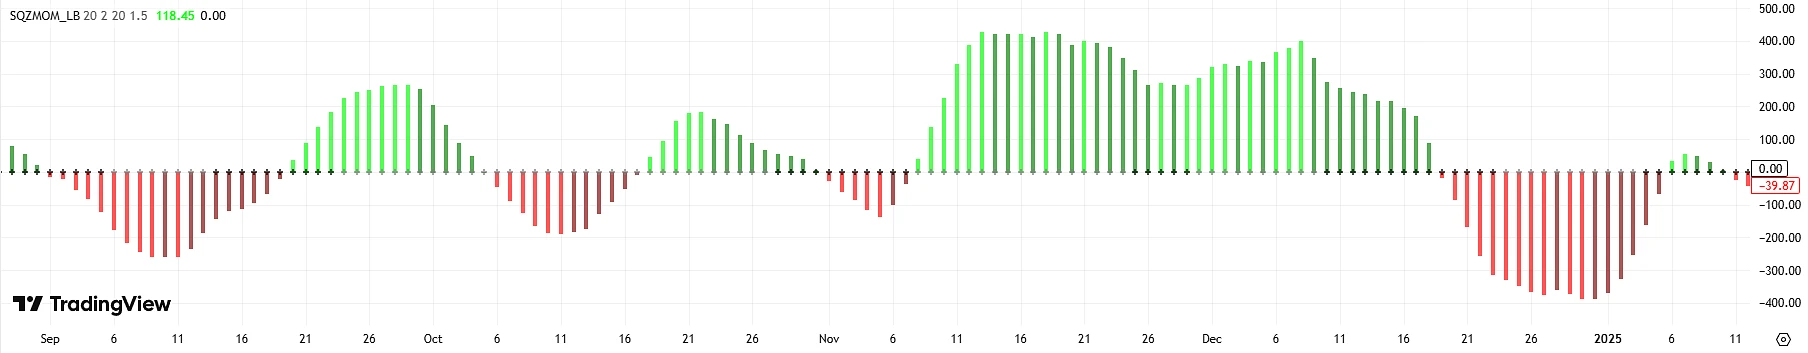
Gray dots
They show the moment when the squeeze ends.
This means:
-
volatility starts to grow
-
the market exits the accumulation phase
-
the move begins
Many traders open positions after the first gray dot appears.
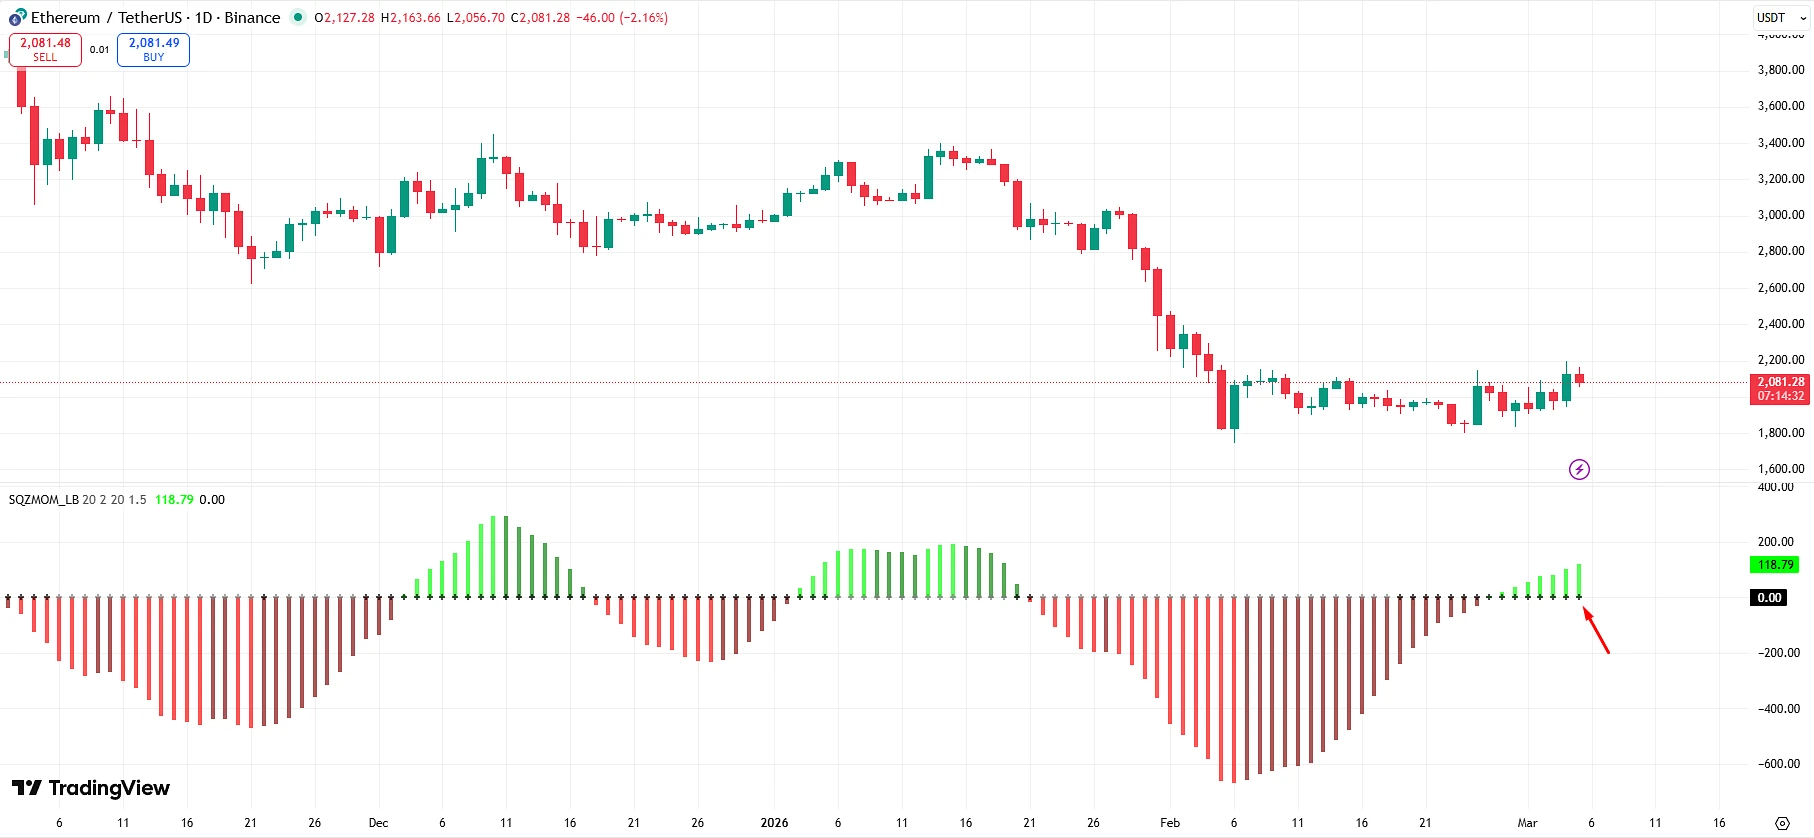
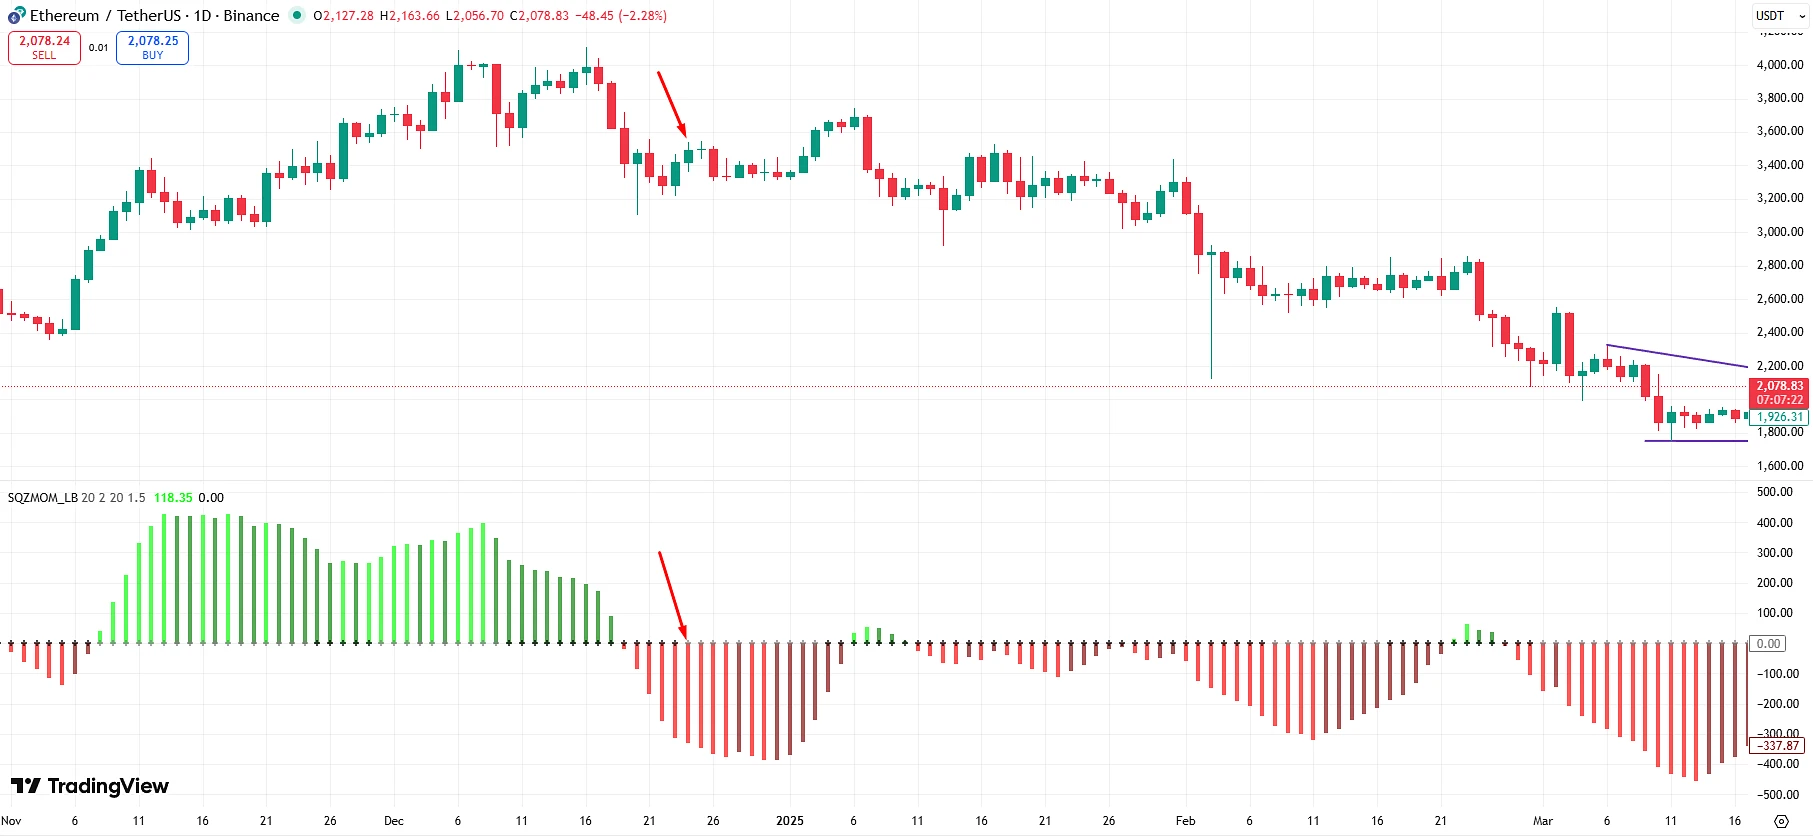
Momentum histogram
The second part of the indicator is the momentum histogram.
It shows the direction and strength of the market move.
Green bars indicate market growth.
Red bars indicate decline.
But it is important to pay attention not only to the color, but also to the dynamics of the bars.
For example:
-
bars are increasing — momentum is strengthening
-
bars are decreasing — momentum is weakening
This helps you understand when a move is gaining strength and when it starts to fade.
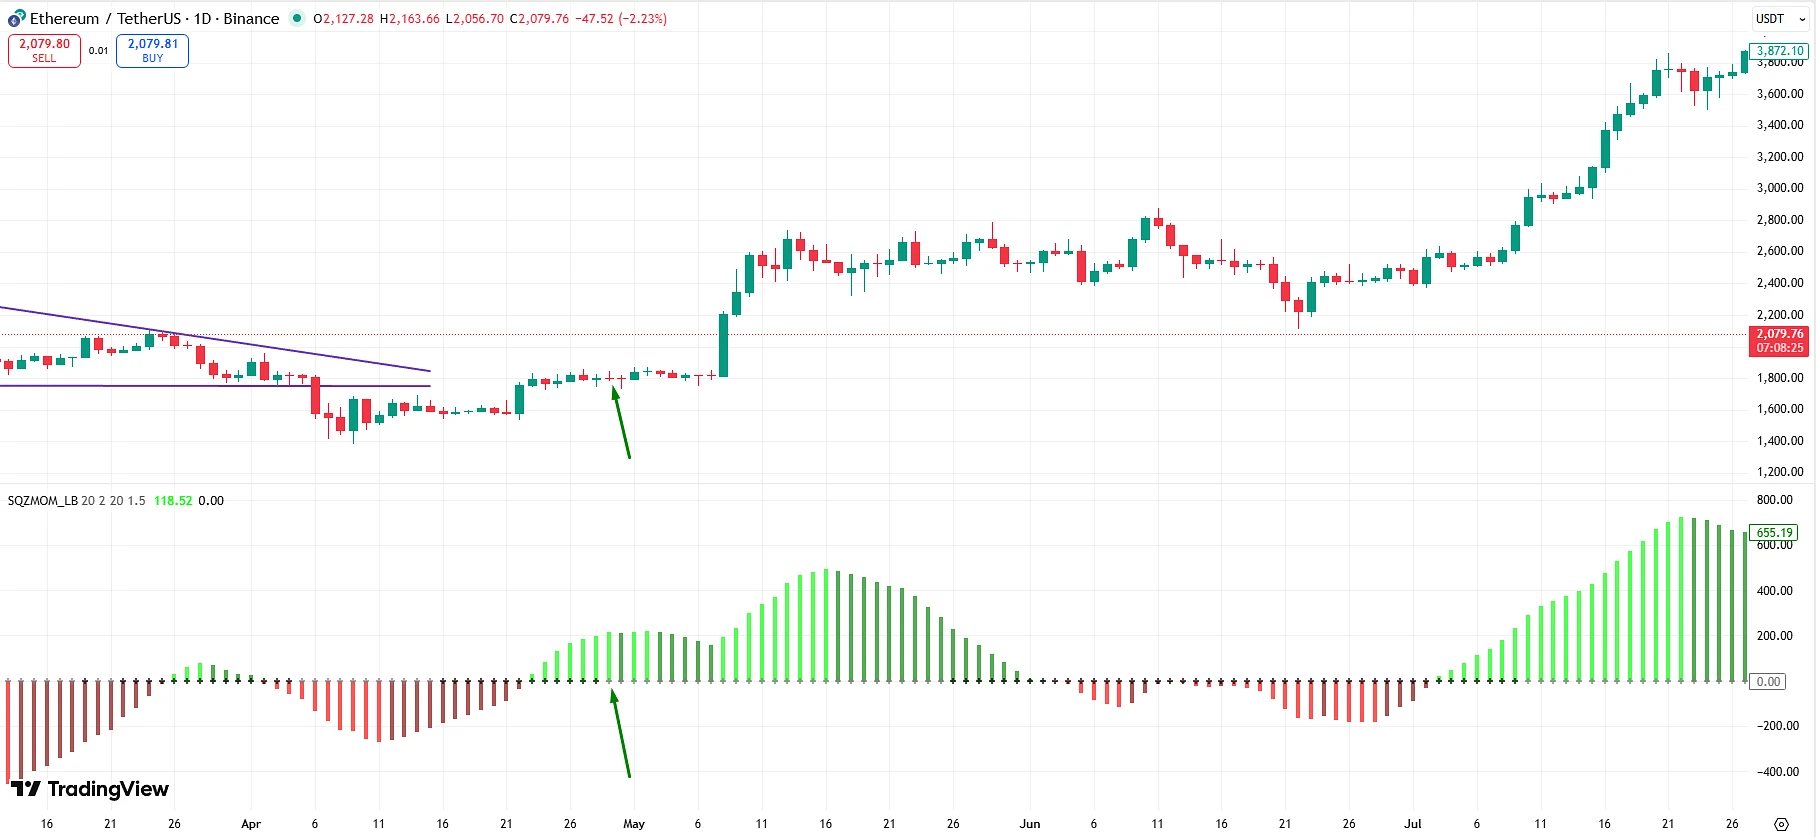
A simple trading strategy
One of the most popular ways to use the indicator looks like this.
Buy signal
-
Black squeeze dots appear on the chart
-
Then the first gray dot appears
-
The histogram turns green
This may signal the beginning of an upward impulse.
Sell signal
-
Black squeeze dots appear
-
Then a gray dot appears
-
The histogram turns red
This may signal the beginning of a downward move.
Why this indicator became so popular
The Squeeze Momentum Indicator gained wide popularity for several reasons.
It helps identify strong moves in advance
It helps you see the moment when the market is accumulating energy.
Simple visual logic
Even a beginner trader can quickly understand how the indicator works.
Suitable for different markets
The indicator can be used on:
-
the Forex market
-
cryptocurrencies
-
stocks
-
indices
Summary
Squeeze Momentum Indicator is one of the most useful tools for finding future market impulses.
It helps identify the moment when the market is in an accumulation phase and preparing for a strong move.
But for maximum efficiency, it is best used:
-
together with other indicators
-
with proper risk management
-
with an understanding of market structure
When used correctly, this tool can become an important part of a trading strategy for both beginner traders and experienced market participants.
How to add Squeeze Momentum Indicator to TradingView
If you want to test this indicator on your chart, you can add it to TradingView in just a few seconds.
👉 Add the indicator to TradingView: Open Squeeze Momentum Indicator
After that, click the Add to Favorite Indicators button, and the indicator will appear in your list.
Bonus for traders
If you trade actively and want to reduce your trading costs, you can use the rebate service Globe Gain.
This service allows you to receive a partial refund of commissions and spreads, which is especially useful for active traders and algorithmic strategies.