

- What MacD Custom Indicator – Multiple Time Frame + All Available Options is
- How to add MacD Custom Indicator – Multiple Time Frame + All Available Options to TradingView
- Why this MACD indicator became popular
- Main indicator features
- How to read the indicator signals
- How to reduce trading fees (a trader lifehack)
- Summary
MacD Custom Indicator – Multiple Time Frame + All Available Options: one of the most popular MACD indicators on TradingView


What MacD Custom Indicator – Multiple Time Frame + All Available Options is
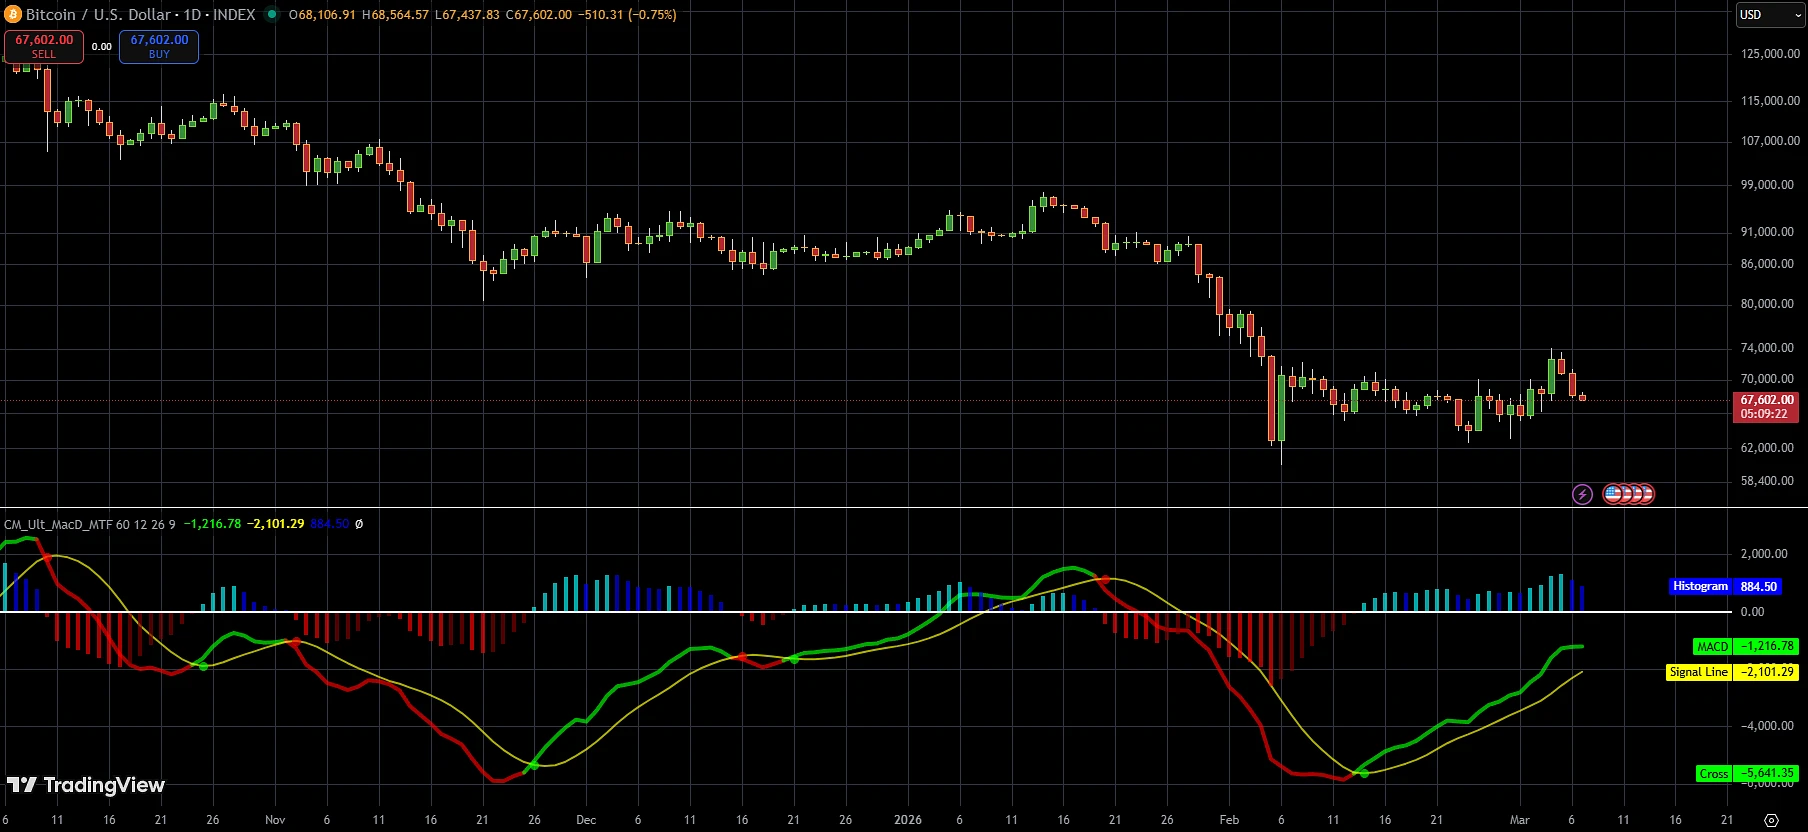
The MacD Custom Indicator – Multiple Time Frame + All Available Options is one of the most feature-rich versions of MACD in the TradingView library.
At the time of writing, this indicator is in the TOP-3 most popular TradingView indicators, which shows strong interest from traders.
It is an enhanced version of the classic MACD that adds:
-
multi-timeframe analysis (MTF)
-
a colored histogram
-
MACD and Signal crossover signals
-
flexible display settings
-
visual entry points
Thanks to these features, the indicator is suitable both for day trading and for medium-term trend analysis.
How to add MacD Custom Indicator – Multiple Time Frame + All Available Options to TradingView
If you want to test this indicator on your chart, you can add it to TradingView in just a few seconds.
👉 Add the indicator in TradingView: Open MacD Custom Indicator – Multiple Time Frame + All Available Options
After opening it, click Add to Favorite Indicators, and the indicator will appear in your list.
Why this MACD indicator became popular
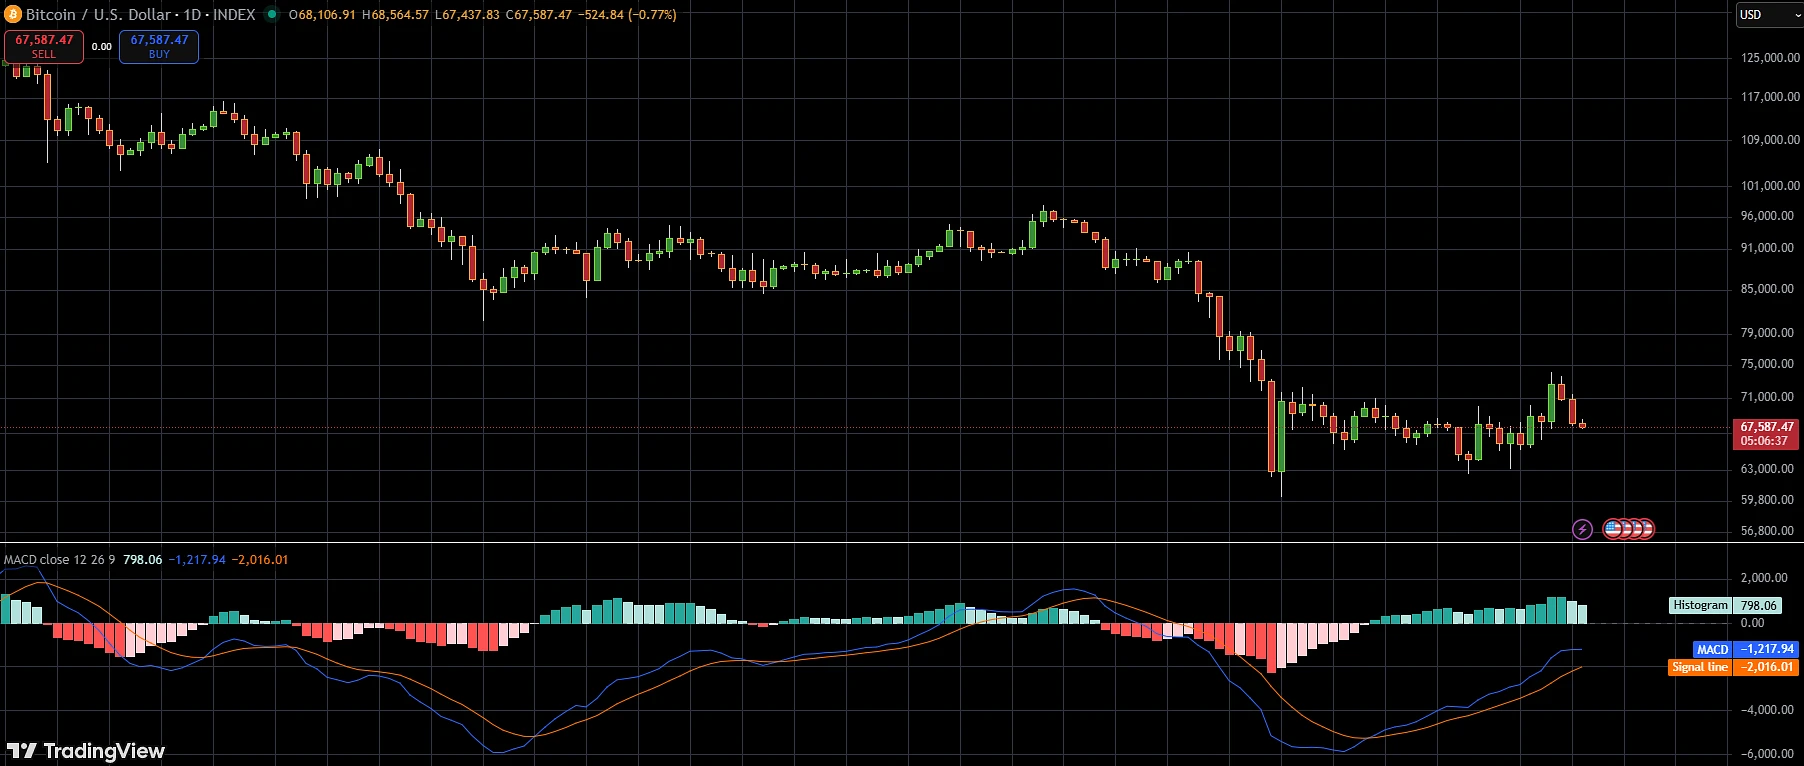
The classic MACD is one of the oldest and most proven technical analysis indicators.
But the standard version has limitations:
-
no multi-timeframe analysis
-
weak signal visualization
-
few settings.
The MacD Custom Indicator – Multiple Time Frame + All Available Options solves these problems.
It allows you to:
✔ view MACD from another timeframe
✔ quickly see market momentum
✔ receive visual crossover signals
✔ analyze trend strength.
Main indicator features
1. Multi Time Frame (MTF)
The indicator lets you analyze MACD from a different timeframe.
For example:
-
chart — H1
-
MACD — D
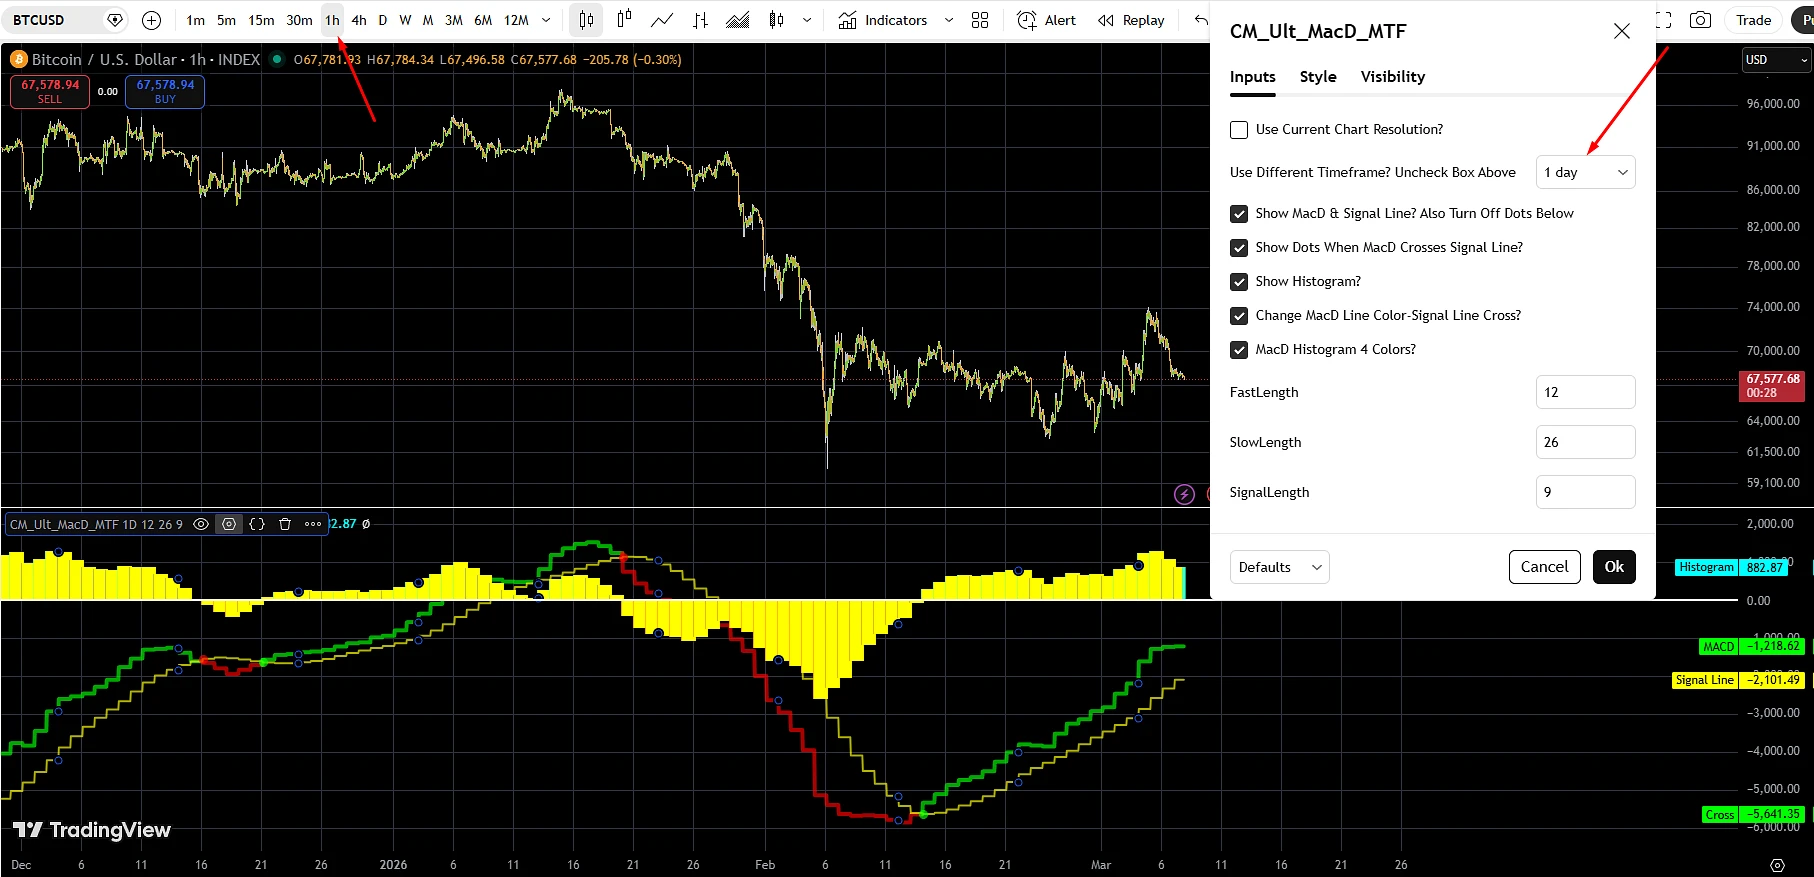
This helps filter false signals and see the global trend.
2. Colored MACD histogram
The histogram changes color depending on:
-
movement direction
-
momentum strength
-
position relative to the zero line.
This makes visual market analysis easier.
3. MACD/Signal crossover signals
When MACD crosses the signal line, dots appear on the chart.
This makes it easy to spot:
BUY signal
SELL signal
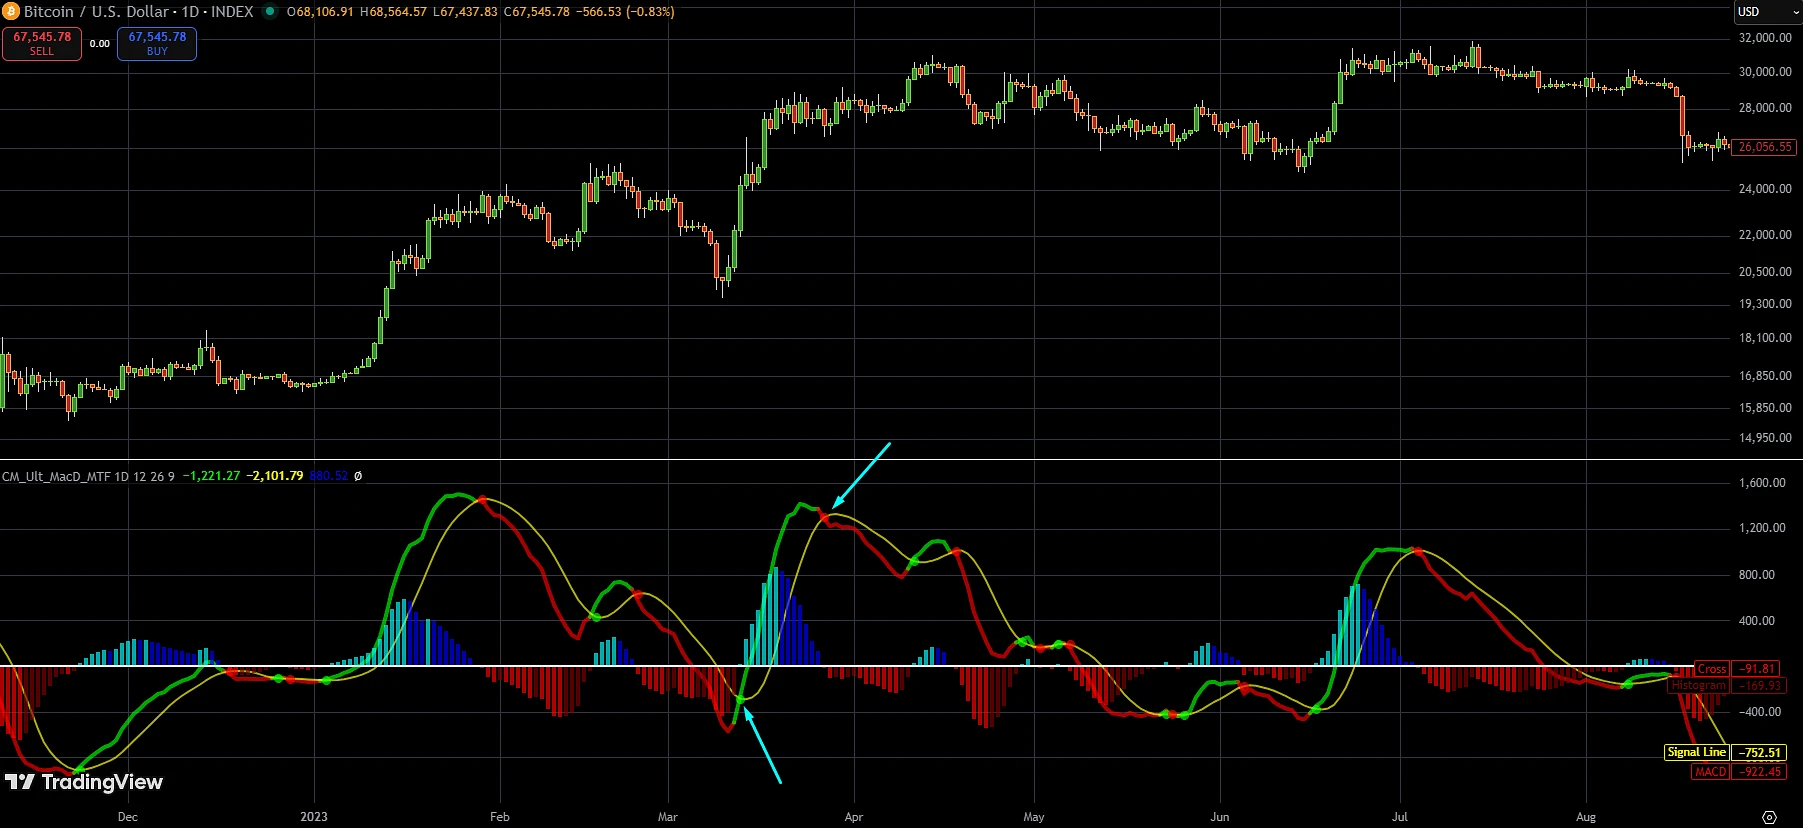
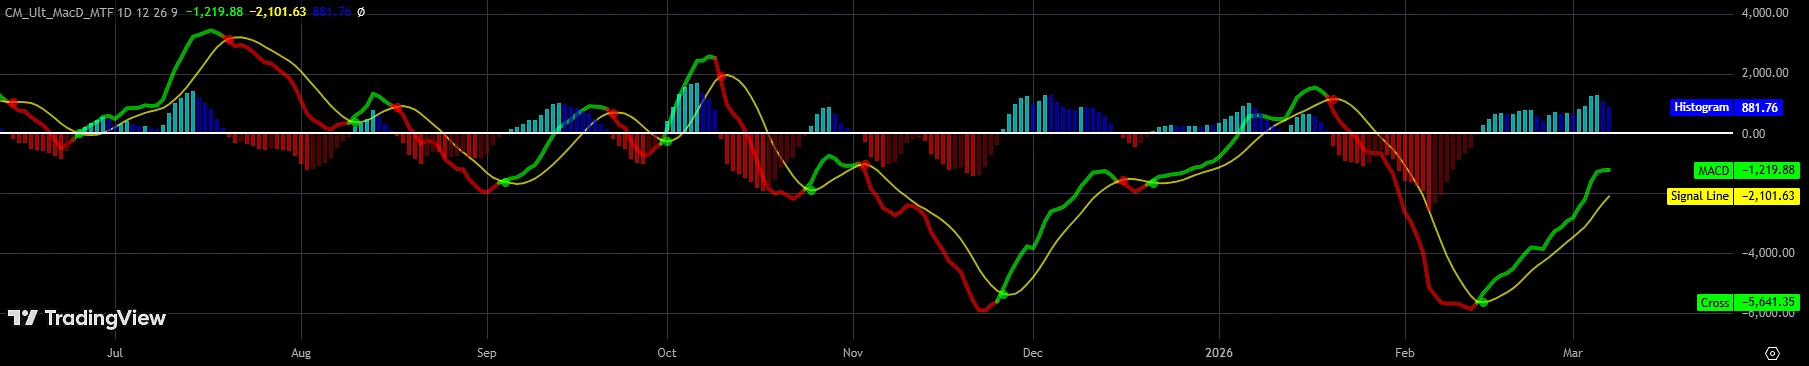
4. MACD line color change
The MACD line changes color depending on its position relative to the Signal Line.
This helps interpret signals faster.
How to read the indicator signals
The indicator shows several key signals.
MACD/Signal crossover
MACD above Signal → a possible BUY signal
MACD below Signal → a possible SELL signal
Zero line
MACD above 0
→ the market is in a bullish trend
MACD below 0
→ the market is in a bearish trend
Histogram
Rising histogram → momentum is strengthening
Falling histogram → momentum is weakening.
How to reduce trading fees (a trader lifehack)
Most traders don’t pay attention to how much they pay their broker.
Every trade includes:
-
spread
-
commission
But part of that money can be refunded.
You can do this via a rebate service Globe Gain.
After registration, you can receive a partial refund of commissions on every trade.
This is especially beneficial if you:
-
trade actively
-
use trading robots
-
work with large volume.
For example, one trader with a $2000 deposit received about $400 in commission rebates over a few months, simply by connecting a rebate service.
Summary
MacD Custom Indicator – Multiple Time Frame + All Available Options is one of the most convenient MACD versions on TradingView.
It combines:
-
multi-timeframe analysis
-
enhanced visualization
-
flexible settings
-
clear signals.
That’s why the indicator consistently ranks among the top popular TradingView scripts.